Your Guide to Understanding Levered Free Cash Flow

Let's get straight to it. Imagine you own a small rental property. After you collect rent, pay the mortgage, cover taxes, and fix the leaky faucet, the cash left in your pocket is what you actually earned.
Levered free cash flow (FCFE) is the exact same idea, but for a public company. It’s the cash left over for shareholders after the company has paid all its bills, including its debt.
The Real "Take-Home Pay" for Shareholders
At its core, levered free cash flow tells you how much cash a business generated for its owners—the shareholders—in a given period. It cuts through the noise of accounting rules to answer the single most important question for an investor: "How much cash did this business actually spit out for me?"
Think of it as the company's discretionary spending money. Once the lights are kept on (operating expenses), investments for the future are made (capital expenditures), and the bank gets its cut (debt payments), what's left is for the owners. This is why we call it "levered"—it specifically accounts for the impact of financial leverage, or debt.
Why FCFE is a Big Deal
Understanding FCFE gives you a clear window into a company's financial health and its power to create value for you, the shareholder. This is the pool of cash that management has to work with to make some pretty important decisions.
Paying Dividends: Companies with strong, steady FCFE can afford to send cash directly to shareholders as dividends.
Buying Back Stock: They can use the cash to repurchase their own shares, which often boosts the stock price for remaining investors.
Funding Growth: It provides the fuel to chase new opportunities or make acquisitions without having to borrow more money.
Paying Down Debt: A healthy FCFE can be used to chip away at existing loans, making the company financially stronger.
In short, FCFE is the cash at the end of the line. It’s what remains after every single stakeholder, from suppliers to lenders, has been paid their due. A business that consistently grows its FCFE is usually a healthy and well-run machine.
By zeroing in on this number, you can see the true cash-generating ability of a company from an owner's point of view. It separates the companies that look good on paper from the ones that are actually printing cash for their investors. That distinction is everything when it comes to making smart investment choices.
Calculating FCFE From Financial Statements
Alright, let's move from theory to practice. Calculating levered free cash flow (FCFE) isn't just an academic exercise; it's about digging into a company's financial statements and pulling out the real numbers. It might look intimidating at first, but it’s a logical process. Think of it as following a trail of money to see what’s truly left for the owners.
There are two main ways to get to FCFE. Each starts at a different point in the financial statements, but they both lead to the same destination. Knowing both gives you flexibility and a much deeper feel for how cash actually moves through a business.
At its core, the logic is simple: you start with the money coming in, subtract what the business needs to spend, and what's left over is for the shareholders.
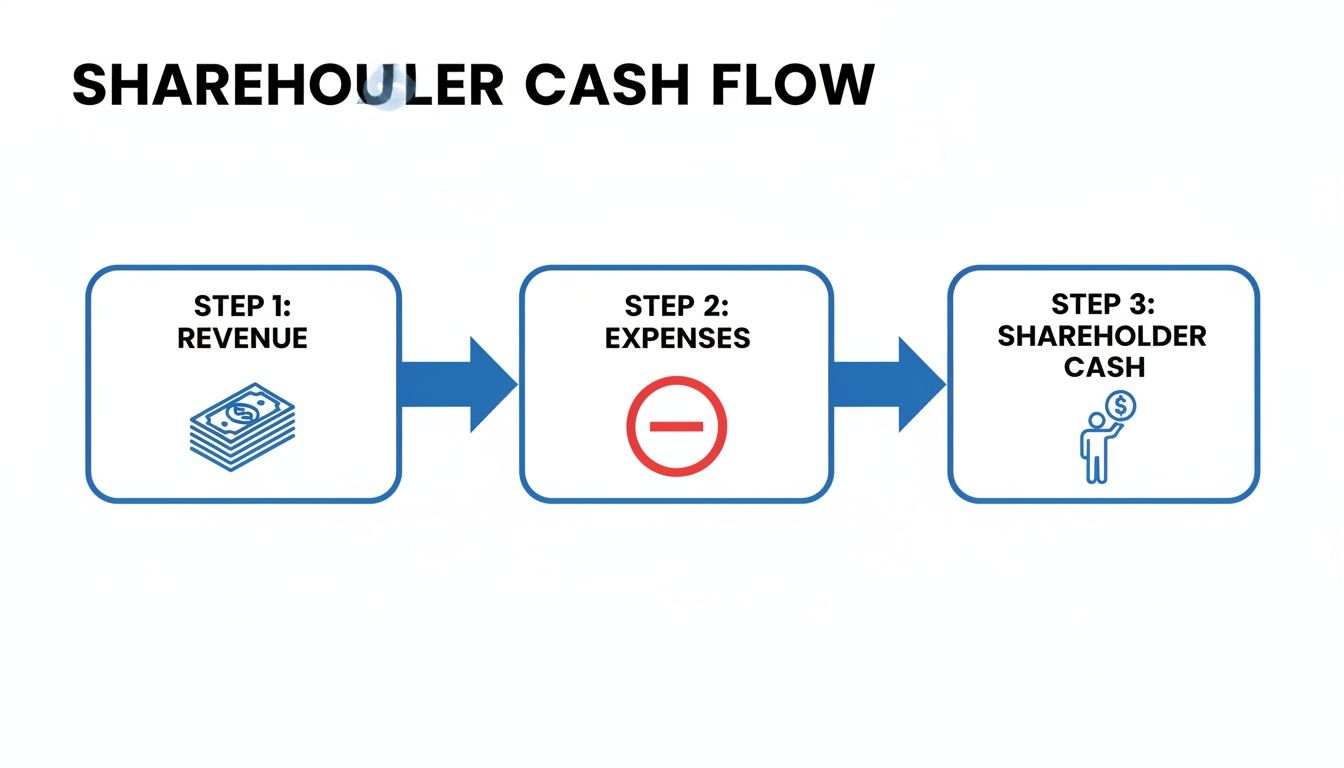
This highlights a key idea: levered free cash flow is the cash that remains after every other obligation has been handled. It’s the true take-home pay for the company's equity owners.
Method 1: Starting from Net Income
This is the most common path. You start with Net Income, the classic "bottom line" on the income statement, and make a series of adjustments to get from accounting profit to actual cash.
The formula looks like this: FCFE = Net Income + Depreciation & Amortization - Capital Expenditures - Change in Net Working Capital + Net Borrowing
Let's break down where each piece comes from.
Net Income: This is your starting point, right at the bottom of the Income Statement. It’s the company's profit after all expenses, including interest to lenders and taxes to the government, have been paid.
Depreciation & Amortization (D&A): These are non-cash expenses. The company didn't actually write a check for "depreciation," it's just an accounting entry that lowers taxable income. Since no cash left the building, we have to add it back. You'll find D&A on the Cash Flow Statement.
Capital Expenditures (CapEx): This is real money going out the door to buy or upgrade long-term assets like factories, machinery, or software. It’s a necessary investment to keep the business running and growing, so we subtract it. Find this on the Cash Flow Statement, usually in the investing section.
Change in Net Working Capital (NWC): This tracks the cash tied up in day-to-day operations. If a company's inventory balloons, for example, that's cash that's been used to buy products that are now just sitting on a shelf. An increase in NWC is a use of cash, so we subtract it. You'll calculate this by looking at the Balance Sheet for this year and last year.
Net Borrowing: This is simply new debt raised minus any debt paid off. If the company borrows more than it repays, that's a cash inflow for shareholders (since the company didn't have to use its own cash to fund things), so we add it. You’ll find this in the financing section of the Cash Flow Statement.
Key Takeaway: The Net Income method is powerful because it starts with the profit figure that legally belongs to shareholders and then makes practical, cash-based adjustments. You’re turning an accounting number into a real-world cash figure.
Method 2: Starting from Cash Flow from Operations
Here's a shortcut. This method starts with Cash Flow from Operations (CFO), which conveniently does a lot of the heavy lifting for you. It’s often much quicker.
The formula is a lot simpler: FCFE = Cash Flow from Operations - Capital Expenditures + Net Borrowing
So, why does this work?
Cash Flow from Operations (CFO): This number, found right at the top of the Cash Flow Statement, has already started with Net Income and adjusted for non-cash items like D&A and changes in working capital. It’s the cash generated from the core business. To learn more about how the statements connect, check out our guide that walks you through the three financial statements.
Capital Expenditures (CapEx): Just like before, we subtract the cash spent on long-term assets. This is a crucial cash outflow that isn't captured in CFO.
Net Borrowing: And again, we add back the net cash from debt activities (new debt minus repayments). This accounts for the cash flows between the company and its lenders.
A Practical Walkthrough
Let's put this into action. Imagine you're analyzing a company and you've pulled these numbers for the year:
Net Income: $500 million
Depreciation & Amortization: $100 million
Capital Expenditures: $150 million
Change in NWC: $25 million
New Debt Issued: $80 million
Debt Repaid: $30 million
First, let's figure out Net Borrowing: Net Borrowing = $80 million (New Debt) - $30 million (Debt Repaid) = $50 million
Now, let's plug these into our first formula (starting with Net Income): FCFE = $500M + $100M - $150M - $25M + $50M = $475 million
That $475 million is the real amount of cash the company could have paid out to its shareholders in dividends or used for stock buybacks. Getting comfortable with these calculations takes you way beyond surface-level metrics. You start to see the true cash-generating engine of a business, which is the foundation of any solid valuation.
Levered vs Unlevered Free Cash Flow Explained
Getting the hang of levered free cash flow (FCFE) versus unlevered free cash flow (FCFF) is a game-changer for any serious financial analyst. They might sound similar, but they answer two completely different questions about a company’s financial health and its ultimate value.
Let’s ditch the jargon and use a simple analogy. Think about a household’s finances:
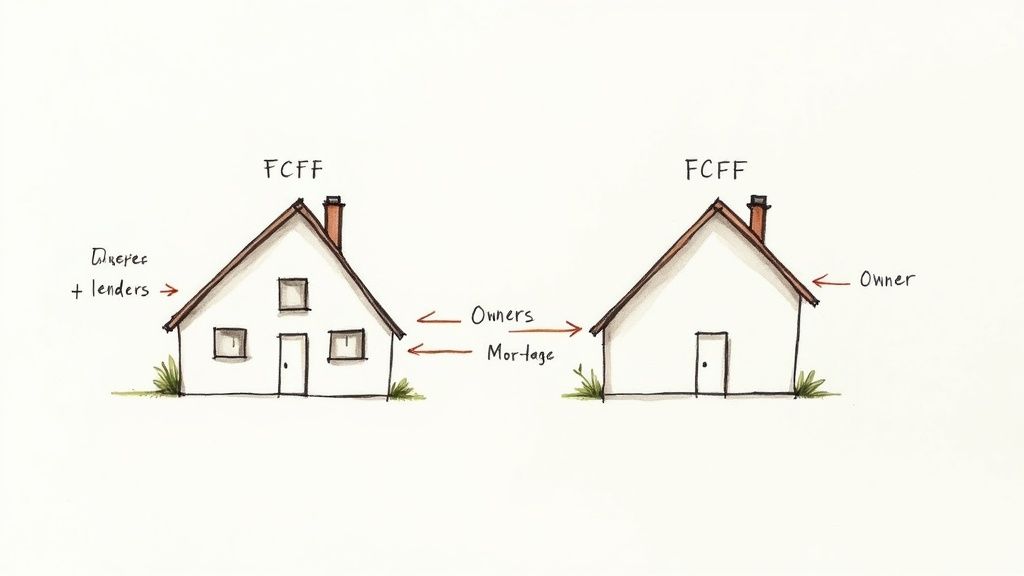
Unlevered Free Cash Flow (FCFF) is like the total income the household brings in before anyone pays the mortgage. This is the pile of cash available to both the homeowners (the equity holders) and the bank that holds the mortgage (the debt holders).
Levered Free Cash Flow (FCFE) is what’s left in the homeowners’ bank account after the mortgage payment is made. This is the money they can actually spend, save, or reinvest.
That's really the core of it. FCFF gives you a pure look at a company's ability to generate cash from its operations, ignoring how it’s financed. FCFE zooms in on what’s actually left for the shareholders after all the bills, especially debt, are paid.
The Impact of Debt
The single biggest difference between these two metrics is how they treat debt. Moving from unlevered to levered cash flow is all about accounting for the money flowing between the company and its lenders.
FCFF is calculated before interest payments and any debt paydowns. It pretends the company has zero debt, which makes it a fantastic tool for measuring a company's raw operational muscle.
FCFE, on the other hand, brings debt right into the picture. It subtracts interest expenses and then adjusts for net borrowing (new debt taken on minus old debt paid off). This gives you a real-world view that reflects the company’s capital structure.
A company with a mountain of debt might have a healthy-looking FCFF but a dangerously low FCFE. This is a huge red flag. It means all that cash from operations is being eaten up by debt payments, leaving almost nothing for the actual owners.
Which Metric Should You Use?
Choosing between FCFE and FCFF isn't about which one is "better"—it's about what you’re trying to figure out. They are different tools for different jobs.
Think of them as different lenses you can use to look at the same company.
Use FCFE when you want to value the company's equity directly. Since this is the cash that belongs to shareholders, it’s the right input for a Discounted Cash Flow (DCF) model that’s trying to find the intrinsic value of a single share.
Use FCFF when you want to value the entire company (its Enterprise Value). Because FCFF is the cash available to all capital providers (both debt and equity holders), it’s used in DCF models that calculate the business's total value. From there, you subtract debt to get to the equity value.
Analysts love using FCFF to compare companies with different debt levels. Since it strips out financing decisions, you get an apples-to-apples view of who is running their core business more efficiently. You can compare a debt-heavy industrial giant to a debt-free tech startup and see their underlying profitability on a level playing field.
The table below breaks down the key differences to help you decide which tool is right for the job.
FCFE vs FCFF Key Differences
Attribute | Levered Free Cash Flow (FCFE) | Unlevered Free Cash Flow (FCFF) |
|---|---|---|
Perspective | Equity Holders | All Capital Providers (Debt & Equity) |
Treatment of Debt | Includes the impact of interest payments and net borrowing. | Excludes the impact of all financing activities. |
Primary Use Case | Valuing a company's equity directly. | Valuing a company's total Enterprise Value. |
Best For | Assessing cash available for dividends and share buybacks. | Comparing the operational performance of companies with different debt levels. |
Sensitivity | Highly sensitive to changes in a company's debt levels. | Insensitive to capital structure choices. |
Ultimately, you need to understand both to get the full story. FCFE tells you what shareholders get in their pocket, while FCFF reveals the true, underlying strength of the business before any financing decisions muddy the waters.
How to Use FCFE for Company Valuation
Calculating levered free cash flow (FCFE) is only half the battle. The real magic happens when you use it to make smarter investment decisions.
FCFE is the most direct link between a company's day-to-day operations and what its stock is actually worth. It helps you answer the ultimate question every investor asks: "What should I really be paying for this stock?"
By zeroing in on the cash available to shareholders, FCFE serves as the foundation for some of the most powerful valuation techniques out there. These methods let you cut through the market noise and quarterly earnings hype to figure out a company's intrinsic value from an owner's point of view.
The most common approach is the Discounted Cash Flow (DCF) model, specifically the FCFE version. It's a cornerstone of financial analysis, especially in investment banking.
The FCFE Discounted Cash Flow Model
The logic behind a DCF model is actually pretty simple: a company’s stock is worth the sum of all the future cash it will generate for its shareholders, just discounted back to what it's worth today.
Think of it like this: a dollar you get next year is worth less than a dollar in your pocket right now. That's because of inflation and the fact you could have invested that dollar today (this is the "time value of money"). A DCF model just applies this principle to a company's entire future stream of cash flows.
Here’s the step-by-step process analysts follow:
Project Future FCFE: First, you have to forecast a company's FCFE for a specific period, usually 5 to 10 years out. This means making educated guesses about future revenue growth, profit margins, capital spending, and debt changes.
Calculate Terminal Value: No one can forecast forever. So, analysts estimate a "terminal value," which represents the value of all FCFE generated after the initial forecast period, assuming the company grows at a stable, long-term rate.
Determine the Discount Rate: Since FCFE is the cash that belongs to equity holders, the right discount rate to use is the Cost of Equity (re). This rate reflects the return shareholders demand for taking on the risk of investing in that specific company.
Discount and Sum It Up: Finally, you take each projected FCFE number (including the big terminal value figure) and discount it back to its present value using the cost of equity. Add all those present values up, and you get the company's total intrinsic equity value. Divide that by the number of shares, and you have your estimated price per share.
This entire process is fundamental to high-stakes finance roles. If you're prepping for interviews, you have to be able to walk someone through this. For more practice, check out our guide on common investment banking technical questions.
A Quicker Valuation Metric: The FCFE Yield
A full-blown DCF model is incredibly thorough, but it's not always practical for a quick check. For that, investors often turn to the FCFE Yield. It gives you a great snapshot of the return shareholders are getting relative to the stock's current price.
FCFE Yield = (FCFE per Share) / (Current Market Price per Share)
Think of the FCFE yield as a smarter, more robust version of an earnings yield. It tells you what percentage of the share price is actually being generated as cold, hard cash for shareholders. A higher yield might suggest a stock is undervalued—you're paying less for more cash-generating power.
This yield is especially sensitive to a company's debt load and the overall economy. For example, the S&P 500's sector-neutral levered FCFY was a strong 9.77% in July of one year but plummeted to 6.27% a year later as interest rates climbed.
That 3.5 percentage point drop shows just how quickly rising debt costs can squeeze shareholder returns. It’s a perfect example of how levered metrics reveal the real-world impact of debt—something that’s absolutely critical for investors to watch in a changing economic landscape.
Whether you’re building a comprehensive DCF model or just running a quick yield calculation, FCFE gives you a direct, cash-focused way to evaluate what a company is truly worth to its owners.
Common Pitfalls When Analyzing FCFE
Levered free cash flow is a sharp tool, but like any powerful instrument, it has to be handled with care. Just grabbing a single FCFE number without digging into the story behind it can lead you way off track. It’s not just about the final figure; it’s about the quality and sustainability of the cash that produced it.
One of the biggest traps is mistaking a temporary cash injection for long-term financial health. A few specific events can puff up FCFE and paint a picture that's way too rosy.
This is why smart analysts learn to look past the headline number and question where the cash really came from. A single year of amazing FCFE might just be an outlier, not the start of a trend.
Watching Out for One-Time Events
A company's FCFE can get seriously skewed by things that have nothing to do with its normal day-to-day business. If you don't spot them, you're going to make some big analytical mistakes.
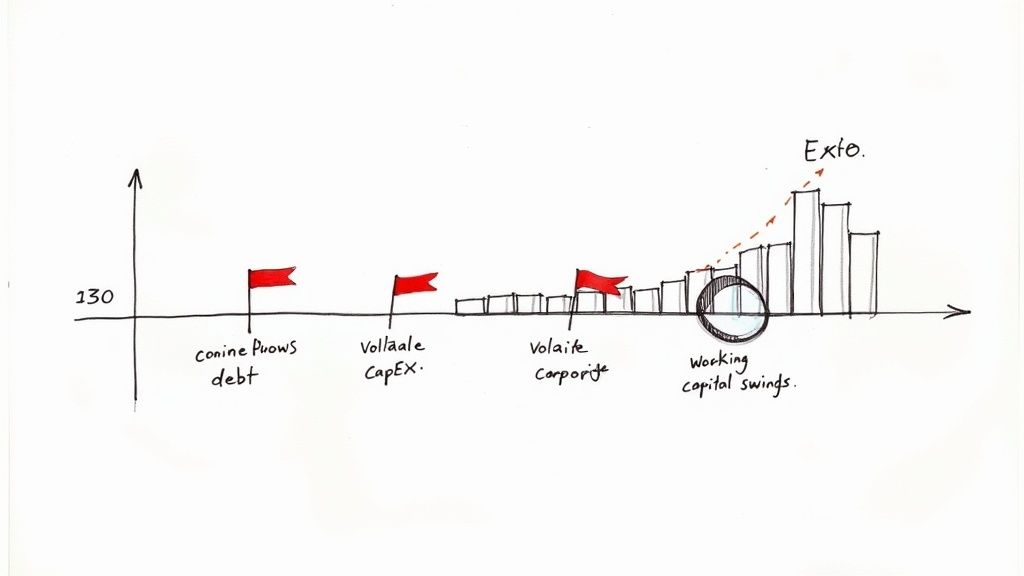
Here are a few red flags to keep an eye out for:
Large Debt Issuances: Remember how net borrowing gets added back in the FCFE formula? Taking on a massive new loan will cause FCFE to spike for that one period. But that cash didn't come from selling more widgets; it's just a loan that has to be paid back.
Asset Sales: If a company sells off a factory or a whole division, the cash that comes in can make FCFE look incredible. This is a one-and-done event, though, and it tells you nothing about the core business's ability to generate cash next year.
Tax Refunds: A big, unusual tax refund can also give cash flow a temporary shot in the arm. It’s another misleading signal if you don't catch it and adjust for it.
The key is to "normalize" the FCFE figure. You have to mentally set aside these weird, one-off items to see the real, sustainable cash-generating power of the business.
Normalizing Volatile Components
Beyond those one-time events, two parts of the FCFE calculation are famously jumpy and need a closer look: Capital Expenditures and Working Capital.
Capital Expenditures (CapEx) can be lumpy. A company might put off buying new machinery for a year to make its cash flow look better, only to get hit with a huge bill the following year. On the flip side, a big strategic investment in a single year can crush FCFE, hiding otherwise strong performance.
To get a clearer picture, many analysts average CapEx over a three-to-five-year period. This smooths out the peaks and valleys, providing a much more realistic view of what the company actually needs to reinvest to stay competitive.
Similarly, Changes in Net Working Capital can swing wildly. A business might lean on its customers to pay up early or drag its feet paying suppliers at the end of a quarter just to boost its cash balance. This is a classic "window dressing" tactic, and it's not sustainable.
Just look at AMC Entertainment Holdings for a masterclass in what happens when debt overwhelms a company. In recent years, AMC's median levered FCF was a jaw-dropping -$714.7 million. While its unlevered FCF might have looked okay before interest payments, the levered number screamed that debt was sucking up every last dollar, leaving nothing for equity holders.
This is a perfect example of how FCFE can act as an early warning signal for financial distress. To get better at spotting these situations, reviewing various investment banking case studies can give you the real-world reps you need.
Answering Your Top FCFE Questions
Once you get the hang of the formulas, you start running into the same tricky questions about levered free cash flow again and again. It's the little details that separate a surface-level understanding from real-world mastery.
This section is all about tackling those common points of confusion head-on. We'll clear up what a negative FCFE number actually means, where stock buybacks fit in, and the slightly counterintuitive reason we add back new debt. Think of this as the final polish on your understanding.
What Does Negative Levered Free Cash Flow Mean?
Yes, FCFE can definitely go negative, and when it does, you need to pay attention. A negative number is a clear signal that the company’s cash from operations wasn’t enough to cover both its capital expenditures (CapEx) and its required debt payments.
Put simply, more cash left the building for investments and debt service than came in from the actual business.
For a young, high-growth company, this might be totally fine—even expected. They’re often pouring every dollar into new facilities or tech to grab market share, sacrificing today's cash flow for tomorrow's growth.
But for a mature, stable company, consistently negative FCFE is a huge red flag. It points to serious problems:
Weak Operations: The core business just isn't pulling its weight and generating enough cash.
Crushing Debt: Debt repayments are eating up all the available cash, leaving nothing for shareholders or reinvestment.
Overspending on CapEx: The company is investing more in its future than it can currently afford from its operations.
A single bad quarter might just be a blip on the radar. But a consistent trend of negative FCFE often signals deep financial trouble, suggesting the company is funding its operations by piling on more debt or diluting shareholders by issuing new stock. Neither is a good look.
How Do Stock Buybacks Affect Levered Free Cash Flow?
This is a classic trip-up question. Stock buybacks are a use of FCFE, not a part of the calculation itself. It's a choice management makes about what to do with the cash that’s available to them.
Think of FCFE as the total pile of cash available to pay out to shareholders at the end of a period. Once that number is set, management has a few options:
Pay Dividends: Hand the cash directly to shareholders.
Repurchase Shares: Buy back stock from the market to (hopefully) boost the value of the remaining shares.
Keep the Cash: Stash the money on the balance sheet for a rainy day or a future opportunity.
Pay Down Extra Debt: Go above and beyond the mandatory payments to lower the company's leverage.
So, share repurchases don't actually change the FCFE figure. FCFE is the number that tells you if the company can even afford a buyback program in the first place. A company funding buybacks with tons of FCFE is a sign of strength. A company funding buybacks by taking on new debt? That's a much riskier story.
Why Is Net Borrowing Added Back in the FCFE Formula?
This is probably the most common point of confusion because adding debt feels backward. The key is to remember the perspective we're taking with FCFE: we are measuring the total cash available to be distributed to equity holders.
When a company takes out a new loan, that cash lands in its bank account. It's now available to be used for anything, including being paid out to shareholders as a dividend. From a shareholder's point of view, that's a cash inflow.
On the flip side, when the company repays the principal on a loan, that cash is gone. It has left the business and gone back to the lenders, so it’s no longer available to shareholders. For an equity holder, that's a cash outflow.
The Net Borrowing calculation (Debt Issued - Debt Repaid) captures this flow perfectly.
If a company borrows more than it repays, you have positive net borrowing. This represents a net cash inflow to the firm that equity holders could theoretically claim, so we add it to FCFE.
If a company repays more than it issues, you have negative net borrowing. This is a net cash outflow from the firm to its lenders, so we subtract this amount (or add the negative number).
By making this adjustment, the FCFE formula gives you the true picture of the cash available to shareholders after all obligations to lenders have been settled.
Ready to stop memorizing and start mastering the technicals that win offers? AskStanley AI is your dedicated prep partner. With infinite technical questions, adaptive drills, and mock interviews that feel real, you can build the muscle memory and confidence needed to ace your superday.
Start your journey to an investment banking offer with AskStanley AI today!