
A Practical Guide to Calculate Operating Income Accurately

To calculate operating income, you simply take a company's total revenue and subtract its Cost of Goods Sold (COGS) and all its operating expenses. This figure, often called Earnings Before Interest and Taxes (EBIT), is one of the cleanest measures of a company's core profitability from its day-to-day business.
What Operating Income Reveals About a Business
Think of operating income as a financial filter. It intentionally strips away the "noise" created by things like a company's debt load (interest expense) or its tax jurisdiction (income taxes). What you’re left with is a clear picture of how well the actual business is running. Can the company make and sell its stuff at a profit? Operating income gives you that answer, straight up.
It's a very different metric from net income, which is the final "bottom-line" number after all expenses are paid. Operating income zooms in exclusively on the results from primary business operations. For analysts and investors trying to gauge a company's true financial health, this distinction is everything.
A business could technically report a positive net income because it sold off a factory for a one-time gain, while its core operations are actually bleeding cash. Operating income cuts through that kind of distortion to show what's really going on.
The Power of Core Profitability
Getting a handle on this metric gives you some serious insight into a company's strength. It's the great equalizer, allowing you to compare competitors more accurately, regardless of how much debt they've taken on or what their tax rates are. You can put two retail companies side-by-side and see who is truly more efficient at the nuts and bolts of selling goods.
A consistently strong operating income is also a signal of a well-run ship. It usually points to a few positive traits:
Efficient Cost Management: It shows the company has a tight grip on its operating expenses, like salaries, rent, and marketing spend.
Strong Pricing Power: A healthy operating income suggests the business can charge enough for its products to comfortably cover all production and operational costs—and still have a solid profit left over.
A Sustainable Business Model: At the end of the day, it proves that the core business idea is sound and can generate profits consistently over time.
You'll find all the data you need to calculate operating income on a company's income statement. This is one of the three core financial statements that form the foundation of financial analysis. If you're new to this, making sure you understand how the income statement, balance sheet, and cash flow statement all work together is a perfect place to start.
Before we jump into the step-by-step calculations, let's quickly break down the key components you'll be working with.
Key Components for Calculating Operating Income
To get to operating income, you need to pull specific line items directly from the income statement. Each one tells part of the story of a company's performance. Here’s a quick rundown of what they are and what they mean.
Component | Definition | Example |
|---|---|---|
Revenue | The total amount of money generated from the sale of goods or services. Also known as "top-line" or sales. | A software company sells $5,000,000 in annual subscriptions. |
Cost of Goods Sold (COGS) | The direct costs attributable to the production of the goods or services sold by a company. | The software company spends $500,000 on server hosting and data fees. |
Gross Profit | The profit a company makes after deducting the costs associated with making and selling its products. (Revenue - COGS) | $5,000,000 (Revenue) - $500,000 (COGS) = $4,500,000 |
Operating Expenses (OpEx) | Expenses a business incurs to engage in its normal business activities, not directly tied to production. | $1,500,000 in salaries, $250,000 in rent, and $750,000 in marketing. |
These line items are the building blocks for our calculation. Once you can confidently identify them on any income statement, finding the operating income becomes a simple process of subtraction.
Walking Through the Operating Income Calculation
Alright, theory is one thing, but the best way to really get this stuff down is to roll up your sleeves and work through an example. Let's build a mini income statement for a fictional software-as-a-service (SaaS) company. We'll call it "Innovate Solutions Inc."
This is how you take the calculation out of a textbook and into the real world. You’ll see exactly where each number comes from and how it all fits together.
Starting at the Top Line: Revenue
Every income statement kicks off with Revenue. This is the total cash a company hauls in from sales before a single expense gets touched.
For our company, Innovate Solutions Inc., let's say they had a great year and brought in $10,000,000 from software subscriptions and service fees. That's our starting block. From here, we'll start chipping away at it with costs.
Deducting the Cost of Goods Sold
First up is the Cost of Goods Sold (COGS). For a SaaS business, COGS represents the direct costs of actually delivering the software. Think of it this way: it's not the cost of marketing or paying the CEO, but the essential, nuts-and-bolts costs of keeping the service running for customers.
These costs usually include things like:
Hosting Fees: Paying for servers and cloud infrastructure (like AWS or Azure) to run the platform.
Third-Party Data Fees: Any money paid for integrated data or APIs that are critical to the software.
Customer Support Salaries: The slice of the payroll for the team that directly helps customers use the product.
Let's assume Innovate Solutions spent $1,500,000 on these items.
To find our Gross Profit, we just subtract COGS from Revenue:
$10,000,000 (Revenue) - $1,500,000 (COGS) = $8,500,000 (Gross Profit)
Gross profit is a super important subtotal. It tells you how profitable the company's core product is before you even think about all the other business expenses. A healthy gross profit is the first checkpoint for a solid business model.
Identifying All Operating Expenses
Now for the costs of actually running the business—the Operating Expenses (OpEx). Unlike COGS, these are the indirect costs you need to keep the lights on and push the company forward.
For Innovate Solutions, OpEx falls into a couple of major buckets.
Selling, General & Administrative (SG&A)
This is a classic catch-all category that covers a ton of essential business functions.
Sales & Marketing: Salaries for the sales team, ad campaigns, commissions. Let's pencil in $2,500,000.
Research & Development (R&D): Salaries for the engineers and developers building new features. We'll allocate $1,200,000 here.
General & Administrative: C-suite salaries, finance, HR, office rent, and utilities. This comes to $800,000.
Add those up, and you get a total SG&A of $4,500,000.
Pro Tip: In the real world, SG&A is often one of the biggest levers a company can pull to manage profitability. Analysts watch this line item like a hawk for signs of efficiency or bloat.
Depreciation & Amortization (D&A)
These are non-cash expenses, but they're very real. They account for an asset losing value over time. Depreciation is for tangible stuff like laptops and office furniture. Amortization is for intangible assets like patents or acquired software.
Let's say Innovate Solutions has a D&A expense of $500,000 for the year. Even though cash didn't literally leave the bank for this expense in the current period, it's a true cost of doing business and absolutely has to be included to get to operating income.
Putting It All Together for the Final Calculation
We finally have all the pieces. The last step is to subtract all the operating expenses from our gross profit.
Here’s the breakdown:
Total Operating Expenses: $4,500,000 (SG&A) + $500,000 (D&A) = $5,000,000
Now for the final move.
Operating Income = Gross Profit - Total Operating Expenses
Let's plug in the numbers for Innovate Solutions:
$8,500,000 (Gross Profit) - $5,000,000 (Total OpEx) = $3,500,000
And there it is. The operating income for Innovate Solutions Inc. is $3,500,000. This number shows the profit the company made purely from its core business operations—before factoring in any interest on debt or taxes. It’s the cleanest measure of how well the actual business is performing.
Calculating Operating Income with Real-World Companies
Theory is great, but let's be honest—it doesn't really click until you see it in action. Applying the operating income formula to a real company, especially a massive one, is where the concept moves from abstract to practical.
Let’s tear down the income statement of a business everyone knows: Walmart. As a global retail giant, its financials tell a fascinating story about scale, efficiency, and the relentless need for cost control. Breaking down its actual numbers shows us exactly how its business model translates into profit.
Analyzing a Retail Behemoth: Walmart
Walmart's entire game is built on two things: massive volume and paper-thin margins. To make a profit, the company has to manage its cost of goods sold and operating expenses with military-like discipline. When you’re dealing with hundreds of billions in revenue, even a tiny inefficiency can blow a hole in the bottom line.
To get to Walmart’s operating income, we’d grab these key lines from its annual income statement:
Total Revenues: All the cash that comes in the door from its stores and e-commerce sites.
Cost of Sales: The direct cost of all the merchandise it sold.
Selling, General & Administrative (SG&A) Expenses: This is a huge bucket that includes everything from employee wages and store rent to marketing budgets and corporate overhead.
The math is exactly what we’ve been talking about. First, we find the gross profit by subtracting the cost of sales from total revenues. Then, we subtract all those SG&A expenses to land on operating income.
A Look at Walmart’s Performance
Let’s look at some recent numbers. Walmart, the world's largest retailer since its founding in 1962, has shown impressive growth in its operating income lately. It hit approximately $29 billion globally in its most recent fiscal year, a nice jump up from $27 billion the year before.
That 7.4% year-over-year increase is a big deal. It tells us that despite a shaky economy, supply chain headaches, and fickle consumer habits, the company is not just surviving but thriving. You can dig into more of this data on Walmart's operating income on Statista.
A jump like that signals that the company isn't just selling more stuff; it's running its core business better. Maybe they negotiated better deals with suppliers, made their logistics network more efficient, or kept a tight lid on administrative costs.
For an analyst, seeing operating income climb alongside revenue is the gold standard. It’s a sign of healthy, sustainable growth—not just growth for growth’s sake.
This is the kind of bread-and-butter analysis done every single day in finance, especially in investment banking. When you’re building a valuation model or just trying to figure out if a company is a good investment, operational profitability is everything. If you're prepping for interviews, you'll need to master this, and practicing with our investment banking case studies is a great way to get sharp.
What the Numbers Signal About Operational Health
When we calculate operating income for a company like Walmart, we’re essentially pressure-testing its business model. The final number answers one critical question: "How good is this company at its primary mission of selling goods to customers?"
It cuts through all the noise from things like interest payments on debt or a company's clever tax strategy. That’s why EBIT is such a pure metric for comparing Walmart against competitors like Target or Costco. Even if they have totally different debt loads or tax situations, their operating incomes can be stacked up side-by-side to see who is running the more efficient retail machine.
A steady or growing operating income over time points to a few very good things:
Market Resilience: The company can hold its ground and stay profitable even when the economy gets rocky or competitors get aggressive.
Cost Discipline: Management has a firm grip on the day-to-day expenses of running the business.
Strong Brand Equity: They have the power to price their products effectively without scaring off customers, which protects their gross margins.
By walking through the financials of a real-world company, calculating operating income becomes more than just a formula you memorized. It turns into a powerful tool for decoding business strategy, operational efficiency, and long-term financial stability. It's a foundational skill for anyone serious about a career in finance.
Navigating Adjustments and Complex Calculations
The path to finding operating income isn't always a clean, straight line of simple subtractions. Real-world income statements are often messy. They're filled with one-off events and accounting quirks that can seriously cloud the picture of a company's true operational health.
To get an accurate read on operating income, a sharp analyst has to learn to spot and adjust for these irregularities. The whole point is to isolate the profit generated from the company's core, repeatable business activities—the stuff they're actually in business to do.

Sifting Through Non-Recurring Items
Companies sometimes have lumpy, unpredictable financial events that have nothing to do with their day-to-day business. We call these non-recurring items, and they have to be stripped out to get a clean look at ongoing profitability.
Think of it like this: if a t-shirt company suddenly sells one of its old warehouses for a huge gain, that profit has nothing to do with how many t-shirts it sold that quarter. Including that gain would artificially inflate operating income, making the core business look far more profitable than it actually is.
Common non-recurring items you should always watch for include:
Gains or Losses from Asset Sales: Profit or loss from selling property, equipment, or even entire business divisions.
Restructuring Costs: Big expenses from major corporate shake-ups, like layoffs, plant closures, or a big reorganization.
Lawsuit Settlements: Large, one-time payments from legal disputes.
Impairment Charges: Writing down the book value of an asset that has lost significant value (think goodwill from a bad acquisition).
By mentally—or physically, in your Excel model—removing these items, you arrive at a "normalized" operating income. This figure gives you a much better baseline for comparing performance across different years or against competitors. It answers the real question: "How is the core business really doing, without all the unusual noise?"
The Impact of Different Accounting Standards
Another layer of complexity comes from global accounting rules. The two big ones are Generally Accepted Accounting Principles (GAAP), used in the U.S., and International Financial Reporting Standards (IFRS), used by most of the rest of the world.
While they're trying to achieve the same goals, they can classify certain expenses differently. For example, a cost might be considered operating under one standard but non-operating under the other. This is why it’s absolutely critical to know which standard a company is using when you compare financials, especially for multinational corporations.
An analyst's job is often more art than science. It's about looking past the reported numbers and using your judgment to build a more accurate story of a company's operational performance.
Take a massive, complex organization like a global professional services firm. Their revenues and costs are incredibly multifaceted. PwC, a leader in the space, recently reported total gross revenues of US$56.9 billion for the 12 months ending in June, an increase from $55.3 billion the prior year. These revenues are broken down into segments like Assurance, Advisory, and Tax & Legal. Operating income is only found after subtracting the vast direct and indirect costs tied to running these global practices. To see how they report it, you can read more about PwC’s global performance here.
Understanding these adjustments is a key skill tested in finance interviews. You’ll be expected to dissect an income statement, pick out any funny business, and defend your adjustments. Honing this ability is crucial, and you can get a feel for it by practicing with the scenarios covered in our guide to common investment banking technical questions. This type of analytical rigor is what separates a novice from a pro when it's time to truly calculate operating income with precision and insight.
Interpreting Operating Income in Volatile Industries
When you calculate operating income for a steady-eddie software company, the numbers usually tell a simple story. But things get a lot more interesting—and a lot more telling—when you look at volatile industries like energy, commodities, or heavy manufacturing.
In these sectors, external forces can send revenues on a wild ride, making metrics like net income almost useless for judging a company's health. Think about it: global commodity prices, geopolitical flare-ups, or sudden supply chain shocks can crush or inflate a company's sales overnight. This is exactly where operating income proves its worth. It cuts through the market noise.
The Energy Sector: A Case Study in Volatility
The energy industry is the perfect example. A company's entire quarter can be made or broken by the price of crude oil or the refining margins for gasoline. A sudden plunge in oil prices will obviously hammer revenue, but that doesn't automatically mean the company is being managed poorly.
Take a company like Global Partners LP, a big player in the energy supply chain. In a recent second quarter, they posted a net income of $25.2 million, a steep fall from $46.1 million the year before. That drop was almost entirely due to shaky commodity prices and refining margins—factors way outside their control. For companies like this, operating income often mirrors the ups and downs of wholesale gasoline and heating oil, giving you a much cleaner look at their core business than net income ever could. You can dive deeper into these dynamics by checking out the latest research on global energy trends on McKinsey.com.
A rookie investor might see that falling net income and hit the panic button. But a sharp analyst will immediately calculate operating income to answer the real question: How well did management control their own costs during the chaos? Did they keep a lid on operational expenses while the market was tanking? That's what EBIT tells you.
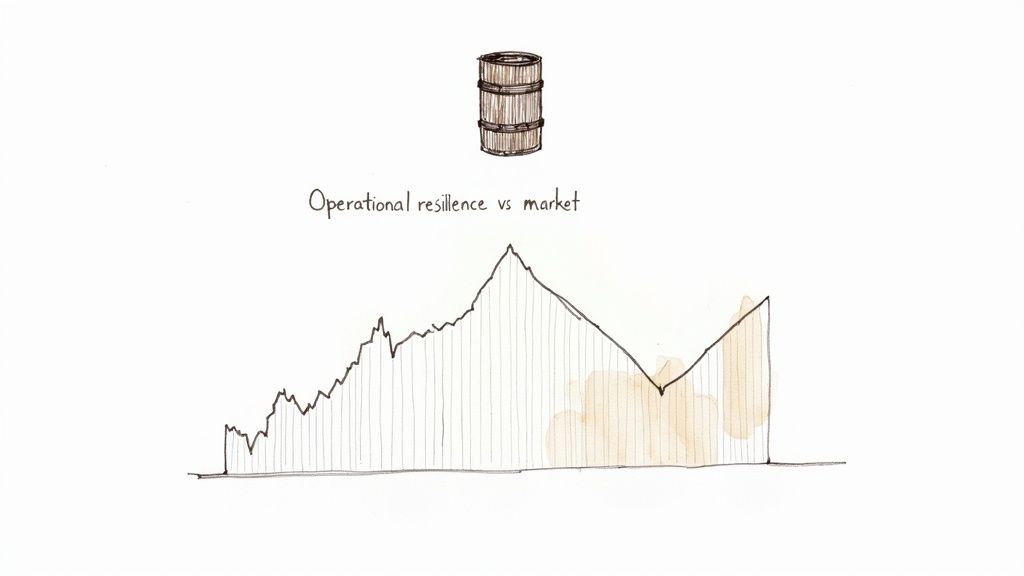
In cyclical industries, operating income isn't about the absolute number. It's about the trend relative to the market. It shows you how skilled management is at navigating a storm, not just sailing in calm seas.
This distinction is everything when it comes to assessing risk. It helps you, the investor or lender, see a company's true resilience.
Uncovering Operational Resilience
In these tough environments, operating income is your clearest signal of a company's underlying strength. It zeroes in on the things management can actually control.
A strong operating income in a volatile sector tells you a few key things:
They have disciplined cost control. The company runs a tight ship, managing its production costs and overhead to protect margins even when revenue gets squeezed.
Their operations are efficient. Management knows how to optimize its supply chain, manufacturing processes, and distribution to ride out the market waves.
They might have a smart hedging strategy. While you won't see this directly in the operating income line, a stable EBIT in a chaotic market often hints that the company is effectively mitigating price risk behind the scenes.
By stripping out financing and tax noise, EBIT gives you a direct look at the business's core earning power. For companies in tough sectors like mining, agriculture, or heavy industry, this figure tells you if the business model is actually sound, regardless of where we are in the economic cycle. It's a non-negotiable metric for anyone serious about investing in these challenging—but often rewarding—industries.
Common Questions About Operating Income
Once you start digging into financial statements, you’ll find that one number often leads to more questions. When it comes to operating income, a few points of confusion pop up all the time, especially when you compare it to other popular metrics.
Let's clear the air and tackle some of the most frequent questions I hear.
How Is Operating Income Different From EBITDA?
The biggest difference between Operating Income (EBIT) and EBITDA comes down to two specific non-cash expenses: depreciation and amortization (D&A).
Operating income is calculated after you’ve subtracted D&A. Think of it as treating the wear-and-tear on a company’s assets as a real, legitimate business cost for that period. This makes it a more conservative, by-the-book measure of profitability.
On the other hand, EBITDA (Earnings Before Interest, Taxes, Depreciation, and Amortization) deliberately adds back D&A to the earnings figure. The whole idea is to get a clearer picture of a company's raw cash-generating power from its core business, since D&A isn't an actual cash expense leaving the bank account.
Key Takeaway: Here's a simple way to think about it: EBIT tells you the profit from core operations based on accounting rules. EBITDA gives you a proxy for the operational cash flow before the company has to reinvest in its assets. This distinction is absolutely critical in capital-intensive industries like manufacturing or telecom, where D&A can be a massive line item.
Can Operating Income Be Negative While Net Income Is Positive?
Absolutely, and it's a huge red flag that every analyst is trained to spot immediately. This happens when a company's core business is actually losing money (an operating loss), but some big non-operating gain comes in and pushes the final net income into the black.
Imagine a struggling retail company that hasn't made a real profit from selling clothes in years—its operating income is consistently negative. But then one quarter, it sells its flagship store in a prime real estate location for a massive one-time gain. That gain is a non-operating item, and it might just be big enough to make the company's "bottom-line" net income look positive.
This is exactly why you have to calculate operating income to understand a company's true health. It cuts through the noise and shows you the reality: the core business is failing, even if a one-off event temporarily props up the final profit number.
Why Do Investors Focus on Operating Income?
Investors and analysts love operating income because it offers a clean, unfiltered look at a company’s core profitability. It isolates how well the main business is doing by stripping away two big variables that can really distort the picture:
Financing Decisions (Interest): A company loaded up with debt will have high interest expenses, which drags down its net income. A competitor with no debt won't have that problem. Operating income lets you compare their operational efficiency on a level playing field, no matter how they chose to fund their business.
Tax Strategies (Taxes): Companies operate in different countries with different tax laws and use all sorts of strategies to lower their tax bill. By looking at profit before taxes, operating income gives you a much more direct, apples-to-apples comparison of how two competitors are performing operationally.
At the end of the day, it answers the most important question: "How good is this company at its actual business?" It's also the foundation for other crucial metrics, like operating margin, which tells you how much profit the company makes for every dollar of sales.
What Common Mistakes Should I Avoid?
When you’re first learning to calculate operating income, a few common slip-ups can trip you up. Just being aware of them is half the battle.
Misclassifying Expenses: The classic mistake is throwing a non-operating expense into the mix. For example, interest expense is a financing cost, not an operating one, and should never be subtracted when you're trying to find operating income.
Forgetting D&A: It's easy to think operating income is just Gross Profit minus SG&A. Don't forget, you have to subtract depreciation and amortization as well to get to the correct EBIT figure.
Ignoring Non-Recurring Items: A surprisingly large one-time gain or loss can make a company look way better or worse than it really is. To get a true feel for ongoing profitability, you need to spot these one-off events and adjust for them.
The best defense is simple discipline. Always double-check your work by carefully tracing the line items right from the income statement. It’s a small step that ensures your analysis is built on solid ground.
Ready to stop memorizing and start mastering the technicals for your interviews? AskStanley AI provides an infinite stream of technical questions, realistic mock interviews, and adaptive drills to make you unstoppable on superday. Build the confidence and consistency you need to land your investment banking offer. Start training with AskStanley AI today