
A Practical Guide to Comparables Company Analysis

A comparable company analysis, or "comps" as you'll hear it called on the street, is one of the most fundamental valuation methods in finance. The idea is brilliantly simple: companies that look and act alike should be valued similarly by the market.
It's a direct, real-time pulse check on what a business is worth.
The Foundation of Relative Valuation

Think about pricing your own house. The first thing you'd do is look at what similar homes in your neighborhood sold for recently. That's exactly what comps do for businesses. It's a form of relative valuation—we're not trying to figure out a company's intrinsic value based on its future cash flows. Instead, we're looking at what the public market is paying for its closest peers right now.
This is a totally different beast than an intrinsic method like a Discounted Cash Flow (DCF) analysis. A DCF tells you what a company should be worth in a perfect, theory-driven world. Comps tell you what investors are actually willing to pay for similar companies in today's messy, real-world market.
Why Comps Analysis is Essential
That market-based perspective is exactly why comps are a non-negotiable part of any valuation toolkit. It’s the ultimate reality check, tethering your theoretical DCF models back down to earth. The beauty of it is how direct and current it is.
Here's why it's so powerful:
It's Market-Based: Comps directly reflect current investor moods, economic jitters, and industry hype. It’s pure supply and demand.
It's Quick and Dirty: Compared to building a massive DCF from scratch, you can pull together a comps analysis pretty fast for a solid valuation snapshot.
It's Defensible: You're grounding your valuation in hard, public data. That makes it a lot easier to explain and defend to a client, your managing director, or an interviewer.
The Evolution and Practice of Comps
The use of comps exploded in the 1980s and 90s, right as financial databases made it possible to screen for peer companies and spread multiples without losing your mind. What used to take days of digging through paper filings could now be done in hours.
Today, every analyst uses platforms like FactSet or Bloomberg to build a peer set of typically 8–15 companies. From there, you calculate multiples like EV/EBITDA and P/E to come up with a valuation range. It’s so standard that it's the first thing banks do to sanity-check their other models—a practice you can learn more about from these foundational principles of comparable company analysis.
Key Takeaway: Comps analysis isn't some stuffy academic exercise; it's a dynamic, real-world gut check. It answers a simple but critical question: "What are people willing to pay for a business like this, today?" This makes it a foundational skill for anyone walking into corporate finance, private equity, or investment banking. The rest of this guide will show you how to build one.
How to Select the Right Peer Group
Let’s be clear: the peer group is the entire foundation of your analysis. If you get this step wrong, nothing else matters. The most elegant model in the world is completely useless if it’s built on a flawed set of comps.
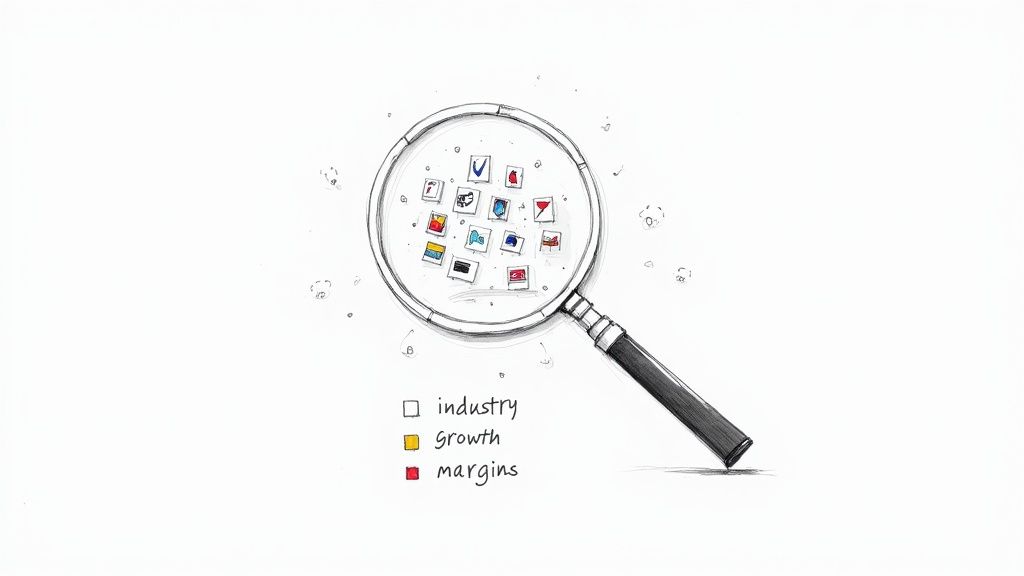
Picking the right peers is more art than science. It's not just about finding companies in the same industry. You're hunting for businesses that are truly similar from an operational and financial standpoint—companies the market values for the same reasons.
Starting with the Business Profile
Before you even think about financial metrics, you need to put on your business strategist hat. The first cut is all about the business itself. You're looking for companies that operate in a similar way, sell to similar customers, and face the same market forces.
Ask yourself these questions to start building a list:
Industry and Sector: What business are they really in? A company building luxury EVs is a world away from one churning out mass-market sedans, even though both are technically "automotive." Get specific.
Products and Services: How do they make money? A software company with a high-touch, enterprise sales model has completely different economics than one with a self-serve subscription product.
Customers and End Markets: Who are they selling to? A defense contractor selling to governments has a totally different risk and sales cycle than a direct-to-consumer e-commerce brand.
Geography: Where do they operate? A company pulling 80% of its revenue from North America is not a good peer for one with 80% from emerging markets. The growth prospects and risks aren't comparable.
Refining with Financial Metrics
Once you have an initial list, it's time to get quantitative. This is where you filter out companies that might look alike on the surface but are completely different under the hood. Two companies can sell the same thing but be at wildly different stages of their lifecycle.
Here are the key financial screens to run:
Size (Market Cap and Revenue): A $50 billion behemoth doesn't play by the same rules as a $500 million competitor. They have different economies of scale, market power, and growth potential. A good rule of thumb is to look for peers within a reasonable range, like 0.5x to 2.0x of your target company's size.
Growth Profile: Look at both historical and projected revenue and EBITDA growth rates. You can't put a high-growth tech disruptor in the same bucket as a stable, mature cash cow.
Profitability Margins: Compare metrics like EBITDA and gross margins. If the margins are wildly different, it’s a red flag that their business models or operational efficiency are too far apart for a fair comparison.
Pro Tip: Don't just screen companies out and move on. The real insight comes from understanding why a company was excluded. If a competitor you thought was perfect has margins that are 2x higher, dig into their 10-K and figure out why. That story is exactly what you'll need to defend your choices later.
Justifying Your Final Peer Set
After all this filtering, you should land on a final group of 8-15 companies. Any fewer, and your analysis can get skewed by one or two outliers. Any more, and you're probably diluting the group with less relevant businesses.
This whole process reveals the central trade-off of comps. The great thing is that it relies on public information, making your process transparent and data-driven. The challenge? Finding truly perfect public peers for a niche or private company is almost impossible. You have solid data thanks to public filings, but those same filings also highlight all the little differences you have to account for. You can read more about the strengths and weaknesses of comparable company analysis to understand these nuances.
Ultimately, your final list isn't just a list—it's an argument. You need to be ready to defend why every company is on it, and just as important, why others were left off. When a Managing Director points to a name and asks, "Why isn't Company X in here?" having a crisp, logical answer is what separates the rookies from the pros.
Gathering and Normalizing Financial Data
Once you’ve locked in your peer group, the real detective work begins. Your comps model is only as credible as the numbers you feed it, which means this part of the process demands serious attention to detail. This isn't just about pulling financials; it's about understanding the story behind them and cleaning them up for a true apples-to-apples comparison.
The first step is grabbing the raw financial data. Your best friends here are public company filings, which offer a standardized and audited look into a company's performance.
10-K (Annual Report): This is your most comprehensive source, packed with audited annual financials and incredibly detailed footnotes. Don't skip the notes.
10-Q (Quarterly Report): This gives you the latest unaudited quarterly numbers, which are essential for calculating Last Twelve Months (LTM) figures.
Investor Presentations & Earnings Releases: These are gold. Management often lays out its own version of "adjusted" or "non-GAAP" figures, giving you a head start on your own normalizations.
Calculating Key Metrics
With the documents in hand, it's time to calculate the core metrics for your analysis. The most fundamental of these is Enterprise Value (EV). EV tells you the total value of a company's core operations for all its stakeholders—both equity and debt holders.
The formula is:
Market Capitalization + Total Debt + Preferred Stock + Minority Interest - Cash & Cash Equivalents
Another must-do calculation is for Last Twelve Months (LTM) figures, sometimes called Trailing Twelve Months (TTM). You'll rarely be doing an analysis that lands perfectly on a year-end, so LTM data provides the most current view of a company's performance.
To get an LTM figure, like LTM Revenue, the formula is simple:
Most Recent Fiscal Year Revenue + Current Year-to-Date Revenue - Prior Year-to-Date Revenue
This "stub period" calculation ensures your analysis reflects the most recent performance, which is non-negotiable in a fast-moving market. A solid grasp of financial statements is essential here. If you need a refresher, check out our guide that explains the three financial statements simply.
The Crucial Step of Normalization
Now for what might be the most important part of this whole process: normalization. This is where you adjust a company's reported financials to strip out any non-recurring, non-core, or unusual items. The goal is to get to a "clean" number—like Adjusted EBITDA—that reflects the company’s true, ongoing operational profitability.
Think of it this way: if you’re comparing two marathon runners, you wouldn’t just look at their last race time. What if one was running with a twisted ankle, or the weather was a freak hurricane? Normalization is the financial equivalent of accounting for that twisted ankle.
These adjustments are critical because GAAP accounting rules don't always capture the economic reality an investor actually cares about. A company might have a huge one-time gain from selling a factory, making its net income look artificially high. Or, a big, non-recurring restructuring charge could make an otherwise healthy company look unprofitable for a quarter. If you ignore these distortions, your valuation multiples will be completely thrown off.
Pro Tip: When normalizing, you'll always add back non-cash expenses like depreciation and amortization to get to EBITDA. But be careful with Stock-Based Compensation (SBC). While it's non-cash, many analysts argue it's a very real economic cost to shareholders and should be treated as a real operating expense. Your bank or fund will have a specific house view on this, so make sure you know what it is.
Spotting and Adjusting Non-Recurring Items
So, where do you find these pesky one-time items? You'll need to comb through the footnotes of the 10-K and 10-Q, especially the Management's Discussion and Analysis (MD&A) section. This is where the company explains its results in plain English and will often call out unusual events.
When you're digging through filings, you're on the hunt for specific line items that don't reflect the core, repeatable business operations. These adjustments are what separate a quick-and-dirty analysis from a professional, defensible valuation.
Here’s a quick guide to some of the most common adjustments you'll be making:
Common Normalization Adjustments in Comps
Non-Recurring Item | Typical Location in Filings | Impact on EBITDA | Impact on Net Income |
|---|---|---|---|
Restructuring Costs | MD&A, Footnotes, Income Statement | Add Back | Add Back (tax-affected) |
Asset Write-Downs | MD&A, Income Statement, Footnotes | Add Back | Add Back (tax-affected) |
Gains/Losses on Asset Sales | MD&A, Statement of Cash Flows | Subtract Gain / Add Back Loss | Subtract Gain / Add Back Loss (tax-affected) |
Legal Settlements | MD&A, Contingencies Footnote | Add Back (if an operating expense) | Add Back (tax-affected) |
Goodwill Impairment | Income Statement, Footnotes | Add Back (it's non-cash) | Add Back (tax-affected) |
Acquisition-Related Costs | MD&A, Footnotes | Add Back | Add Back (tax-affected) |
Effectively "scrubbing" the financials of these items is what makes your analysis robust. It ensures that the multiples you calculate reflect sustainable performance rather than temporary noise. Once you have these clean, comparable numbers, you're ready for the final step: calculating and applying the valuation multiples.
Calculating and Applying Valuation Multiples
Alright, you've done the heavy lifting. You’ve picked your peer set and scrubbed their financials clean. Now comes the fun part—turning all that data into a real, defensible valuation range. This is where the magic happens, where raw numbers become an actual estimate of what a company is worth.
You should now have clean, comparable metrics like Revenue, EBITDA, and Net Income for every company in your peer group. The goal from here is to create ratios, or valuation multiples, that let you make an apples-to-apples comparison, no matter how big or small the companies are.
This whole process hinges on getting the normalization right. You can't just pull raw numbers and expect an accurate result.
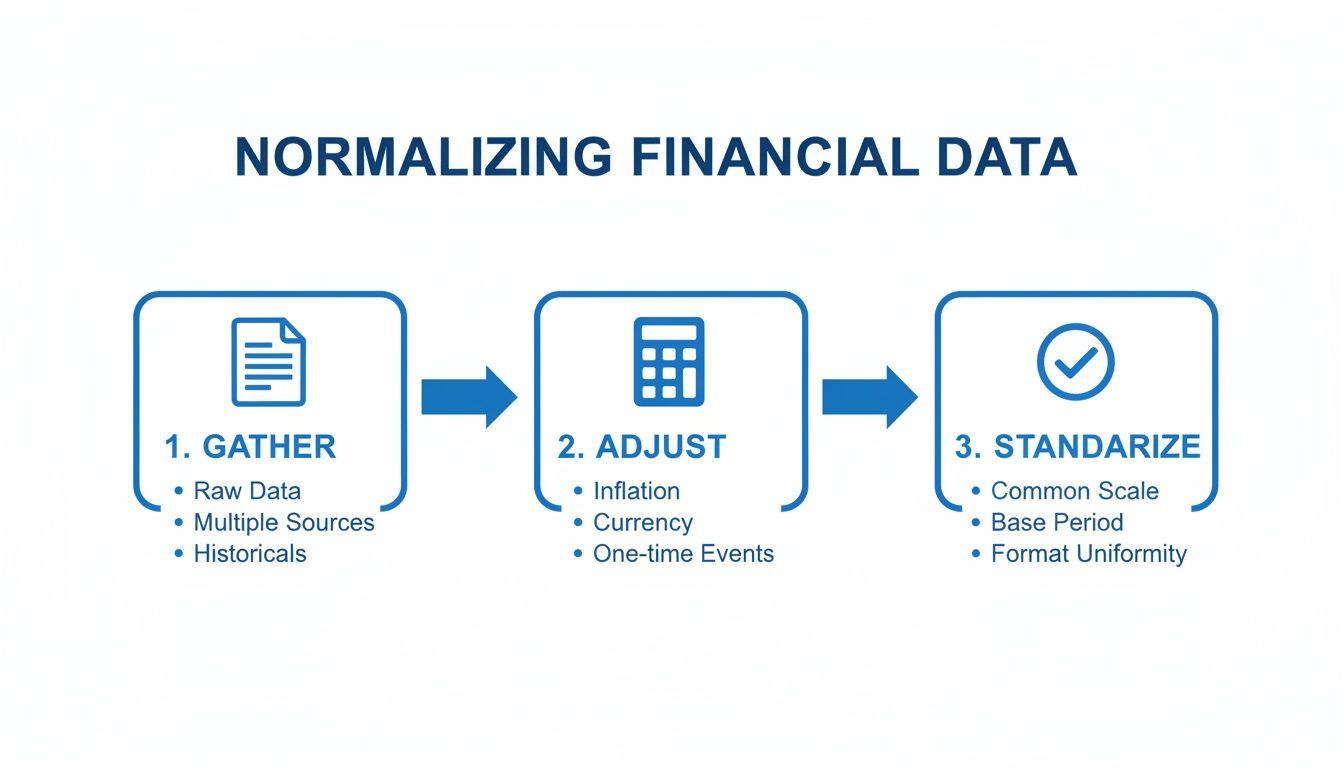
As the graphic shows, a solid valuation is built on a disciplined three-step process: gathering the data, making sharp adjustments, and then standardizing everything across the board.
Computing the Core Valuation Multiples
The multiples you pick will depend on the industry and the company you’re valuing. But there are a few workhorses you’ll see in almost every comps analysis.
Here are the most common ones you'll be calculating:
EV / LTM Revenue: This is your go-to for companies that aren't profitable yet or are in a crazy high-growth phase. It tells you what investors are willing to pay for every dollar of sales.
EV / LTM EBITDA: Often called the gold standard. Because it uses Enterprise Value and looks at earnings before interest and taxes, it’s not thrown off by a company’s debt load or tax rate. This makes it fantastic for comparing companies with totally different financing strategies.
P / LTM E (Price-to-Earnings): The classic P/E ratio. It compares a company's stock price to its earnings per share. It's an equity value multiple, so it’s best for mature, consistently profitable businesses. Just be aware that it can be skewed by different accounting rules and debt levels.
To get these numbers for your peer set, you just divide the right valuation metric (EV or Market Cap) by the financial metric (Revenue, EBITDA, or Net Income) for each comparable company.
From Raw Multiples to a Usable Range
Once you have a list of multiples for each peer, you can't just grab one at random. You need to figure out a representative range. The standard practice is to calculate the mean, median, 25th percentile (Q1), and 75th percentile (Q3) for each multiple.
The median is your best friend here. It’s far less likely to get skewed by crazy outliers than the mean. If one company in your set is trading at a ridiculous multiple because of an M&A rumor, the mean will get dragged way up. The median, on the other hand, will stay put, giving you a much more reliable sense of the group’s true center.
This statistical breakdown gives you a low, middle, and high range to work with. For instance, your analysis might show that the peer group’s median EV / LTM EBITDA multiple is 10.5x, with a 25th percentile of 8.5x and a 75th percentile of 12.5x. This becomes the valuation toolkit you’ll apply to your target company. You can get better at interpreting these ranges by digging into different investment banking case studies.
Applying the Multiples to Your Target Company
The final move is to take this range of multiples and apply it to your target company's own financials. This is how you directly translate the market’s view of the peer group onto the company you're actually analyzing.
Let's walk through a quick example. Say your target company has a normalized LTM EBITDA of $50 million. Using our peer group range from above:
Low Valuation (25th Percentile): $50M EBITDA x 8.5x = $425 million Implied Enterprise Value
Median Valuation: $50M EBITDA x 10.5x = $525 million Implied Enterprise Value
High Valuation (75th Percentile): $50M EBITDA x 12.5x = $625 million Implied Enterprise Value
And just like that, you have a defensible implied EV range of $425M - $625M for your target.
If you had used an equity multiple like P/E, this calculation would give you an implied equity value directly. But since we used EV-based multiples, we have one more step: work backward to find the implied equity value by subtracting debt and adding back cash. This systematic approach is what turns raw market data into a powerful valuation tool.
Interpreting Results and Avoiding Common Mistakes
You’ve calculated the multiples and landed on an implied valuation range. Congrats, you did the math. But this is where the real analysis begins. A spreadsheet full of numbers is useless without a story behind it, and this final step is what separates a technician from a true analyst.
Think of your valuation output as the starting point for a conversation. Why does your target company trade at a premium or a discount to its peers? The answer isn't just in the numbers you crunched; it’s in the qualitative story that explains them. This is where you connect the quant to the fundamentals of the business.
Building the Narrative Behind the Numbers
One of the biggest traps analysts fall into is blindly applying the median multiple and calling it a day. The real value is in understanding the distribution of multiples across your peer set. Is there a good reason why the top-quartile companies are trading at 15x EBITDA while the bottom-quartile is stuck at 8x?
You need to dig into the qualitative drivers:
Market Leadership: Does the company have a dominant market share or a brand that gives it pricing power?
Growth Profile: Is the company growing way faster than its peers, justifying that higher multiple?
Profitability & Margins: Does it have killer operating margins because of a lean cost structure or better tech?
Competitive Moat: Is there a real barrier to entry, like proprietary patents or high customer switching costs, that protects its future earnings?
Knowing these drivers lets you intelligently position your target company within that valuation range. You can build a defensible argument like, "Our target deserves to trade closer to the 75th percentile because its 25% growth rate is more than double the peer median of 12%." That’s a compelling story.
Visualizing the Valuation with a Football Field Chart
To present your findings effectively—especially next to other methods like a DCF or precedent transactions—the "football field" chart is the undisputed industry standard. It’s a simple but powerful chart that visually lays out the valuation ranges from each methodology on a single graph.
It’s powerful because it immediately shows you where the ranges overlap and gives you a holistic view of the company’s potential value. If your comps analysis spits out a range of $500M - $650M and your DCF suggests $550M - $700M, that area of convergence gives you a much higher degree of confidence in your final number.
Key Takeaway: A comparable company analysis is as much an art as it is a science. You identify peers, gather their financials, calculate multiples, and apply them to your target. The real skill is interpreting that data to build a compelling valuation narrative, a process you can explore through these detailed insights into comparable analysis methods.
Avoiding the Most Common Pitfalls
Even the sharpest analysts can fall into common traps that completely undermine the credibility of their work. Knowing what they are is the best way to make sure your analysis is solid and defensible.
Here are the critical mistakes to watch out for:
Using a Flawed Peer Group: This is the original sin of comps. If your peers aren't truly comparable in business model, size, and financial profile, your entire analysis is built on a foundation of sand.
Ignoring Normalization: Failing to adjust for one-time, non-recurring items is a rookie mistake. A massive restructuring charge or a one-off gain from selling a building can completely distort a company's real operating performance and make your multiples meaningless.
Blindly Applying the Median: The median is a safe harbor from outliers, but it’s not always the "right" answer. You should always be asking why your company should or shouldn't trade at the median based on its unique strengths and weaknesses.
Mixing Enterprise and Equity Value: Never, ever mix and match these. An enterprise value multiple (like EV/EBITDA) must be applied to an enterprise-level metric (EBITDA). An equity value multiple (like P/E) must be applied to an equity-level metric (Net Income). Getting this wrong is a fundamental, instant-fail error.
Frequently Asked Questions about Comps Analysis
Even when you feel like you have the process down, a comparable company analysis always has its own quirks and tricky spots. Here are some of the most common questions I've seen pop up, whether you're building your first model from scratch or just trying to sharpen your skills before an interview.
Think of these as the quick, straight-to-the-point answers you need.
What Is the Difference Between Enterprise and Equity Value?
This is a foundational concept you absolutely have to nail. No way around it.
Think of Enterprise Value (EV) as the total price tag for a company’s core business operations. It’s what you’d have to pay to acquire the entire firm, including its debt, for all its capital providers (both debt and equity holders).
Equity Value, on the other hand, is the slice of the pie that belongs just to the shareholders. It's the value left over after you’ve settled all the company's debts. This is why you must always match your multiples: EV goes with operating metrics like EBITDA, while Equity Value goes with shareholder-focused metrics like Net Income.
How Many Companies Should Be in a Peer Group?
There's no single magic number, but the industry standard is to aim for a peer set of 8 to 15 companies. It's all about striking the right balance.
Fewer than 8 peers: Your analysis gets way too sensitive. Just one outlier with a crazy high or low multiple can throw off your entire median and mean, making your valuation range pretty much useless.
More than 15 peers: You start to water down the quality of your comparisons. To hit a number that high, you almost always have to start including companies that aren't really comparable, which defeats the whole point of the exercise.
At the end of the day, quality beats quantity. A tightly-vetted list of 10 truly similar companies is way more defensible than a sloppy list of 25.
Can You Use Comps for Private Companies?
Absolutely, but you can't just slap public multiples onto a private company. It’s a common practice, especially when you can’t find good M&A transaction data, but it requires a crucial adjustment.
Private companies are inherently less liquid. You can't just log into your brokerage account and sell your shares tomorrow. To account for this, analysts apply a liquidity discount to the valuation they get from the public comps. This discount typically falls in the 20% to 40% range.
Key Takeaway: The valuation you get from public comps is just a starting point for a private company, never the final answer. That discount for lack of marketability is a non-negotiable step that reflects the real-world difference between owning public vs. private stock.
What if My Target Company Has Negative EBITDA?
This happens all the time, especially with high-growth companies in sectors like tech or biotech that are burning cash to scale. When EBITDA is negative, the EV/EBITDA multiple is meaningless—you can't have a negative valuation multiple.
The move here is to go "up" the income statement to a metric that is positive. The most common alternative is the EV/Revenue multiple. This lets you value the company based on its top-line sales, which makes sense for businesses where growth is the main story, not current profitability.
This is a classic interview topic, so it's worth reviewing a wide range of investment banking technical questions to make sure you're prepared for any curveballs. If even revenue isn't a good fit, you might have to get creative with industry-specific metrics, like EV/Subscribers for a SaaS or streaming company.
Ready to master the technicals and land your dream offer? AskStanley AI provides an all-in-one training platform with unlimited mock interviews, adaptive drills, and detailed performance tracking to get you interview-ready faster. Stop memorizing and start mastering at https://www.askstanley.ai.