How to Calculate WACC The Right Way

To calculate WACC, you're essentially blending a company's cost of equity and its cost of debt, weighted by their proportions of the company's total value. It all boils down to one core formula:
WACC = (E/V × Re) + (D/V × Rd × (1 – Tc))
In simple terms, you're taking the cost of equity (Re) and the after-tax cost of debt (Rd) and weighing them based on how much of the company's total value (V) comes from equity (E) versus debt (D). The result is a single percentage that acts as a critical hurdle rate for investment decisions.
Why WACC Is a Cornerstone of Business Valuation
Before we get into the number-crunching, it's crucial to understand what the Weighted Average Cost of Capital actually is. Think of it as the average rate a company pays to finance its assets. This single number is the engine behind Discounted Cash Flow (DCF) models, helping analysts figure out what a company is really worth.
Essentially, WACC answers one fundamental question: "What's the minimum return this company needs to earn on its assets to keep its investors and lenders happy?"
If a new project is expected to generate a return higher than the WACC, it creates value. If it’s lower, it destroys value—even if the project looks profitable on paper.
The Logic Behind the WACC Formula
The WACC formula elegantly combines a company's two main sources of capital. For example, a Wall Street Prep analysis estimated Apple's WACC at 11.7%, using a higher-than-usual equity risk premium of 8% to reflect market conditions. This just shows how much the final number can swing based on your assumptions.
The formula provides a complete picture by factoring in:
Cost of Equity (Re): This is the return shareholders demand for the risk they take by owning the company. It's an implicit cost since dividends aren't legally required.
Cost of Debt (Rd): This is the effective interest rate the company pays on its debt. Unlike equity, this is an explicit, observable cost.
The Tax Shield: Here's the kicker. Interest payments on debt are tax-deductible. The
(1 - Tc)part of the formula accounts for this "subsidy" from the government, which makes debt cheaper.
A lower WACC is generally a sign of a healthy business. It means the company is seen as lower risk and can get capital more cheaply, which usually leads to a higher valuation since its future cash flows are discounted at a lower rate.
Mastering this calculation is a powerful tool for analyzing investments and making strategic decisions. It's a foundational concept that comes up constantly in finance interviews. You won't just be asked how to calculate WACC, but why each piece matters. You can see how this plays out in real-world scenarios in our deep dive on investment banking case studies.
Mastering the Cost of Equity with CAPM
This is where calculating WACC starts to feel more like an art than a science. The cost of equity (Re) isn't a hard number you can just look up. Unlike debt, which has a clear interest rate, the cost of equity is what shareholders expect to earn for the risk they're taking by owning a piece of the business.
The go-to method for figuring this out is the Capital Asset Pricing Model (CAPM). It’s the industry standard for a reason—it gives us a logical way to connect risk and expected return.
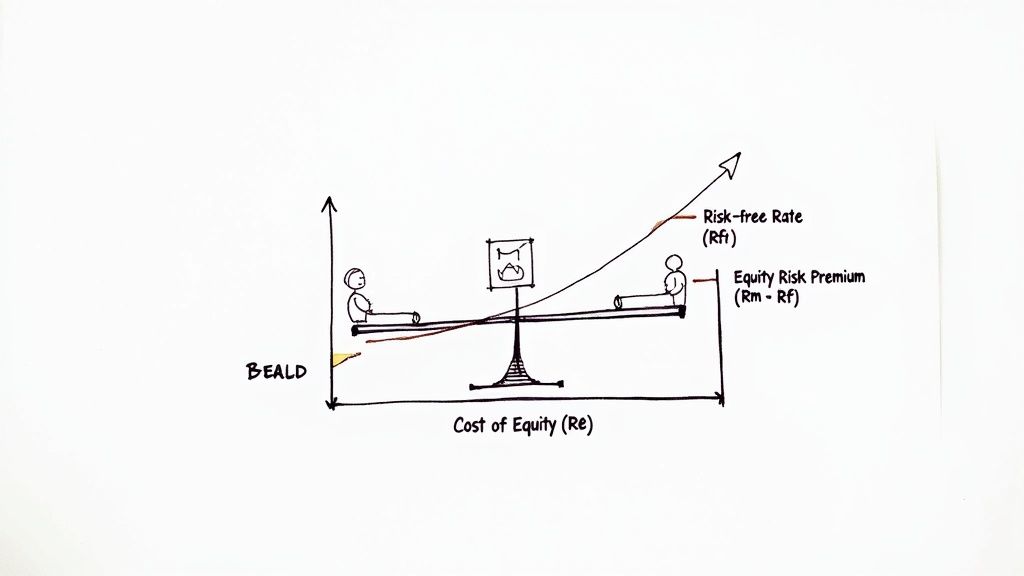
The formula itself is clean and simple:
Re = Rƒ + β * (Rm – Rƒ)
Let's pull back the curtain on each piece of this puzzle to see where the numbers really come from.
Finding the Risk-Free Rate
First up is the risk-free rate (Rƒ). This is the theoretical return you'd get from a completely risk-free investment. Of course, no investment is truly risk-free, but the yield on a long-term government bond is the closest we can get.
For companies in the U.S., the standard practice is to use the yield on the 10-year or 20-year U.S. Treasury bond. Why long-term? Because WACC is used to evaluate long-term projects and valuations, so your assumptions need to match that timeline. You can grab this number from financial sites like Bloomberg or directly from the U.S. Department of the Treasury's website.
A common rookie mistake is using a short-term rate, like a 3-month T-bill. This can seriously understate your cost of equity, especially when interest rates are all over the place.
Understanding the Equity Risk Premium
The next chunk of the formula, (Rm – Rƒ), is the Equity Risk Premium (ERP). Think of it as the extra juice investors demand for putting their money in the stock market instead of sticking it in "safe" government bonds.
This number is one of the most debated inputs in all of finance. It’s a forward-looking guess, not a hard fact. Analysts usually land on a number using one of these methods:
Looking back: Analyzing the historical average return of the stock market (like the S&P 500) over long-term bonds.
Implied ERP: Back-solving for the premium based on current stock prices and expected future cash flows.
Published estimates: Relying on academic studies or data providers who publish their own ERP estimates.
In practice, most analysts and bankers use a consensus figure that lands somewhere between 4.5% and 6.0% for the U.S. market. Sticking within this range is almost always considered a reasonable and defensible choice.
Key Takeaway: The Equity Risk Premium is an assumption. The important thing isn't finding the one "correct" number, but choosing a reasonable one and being ready to explain why you picked it. A small tweak here can ripple through your entire valuation.
Demystifying Beta
That brings us to Beta (β), arguably the most critical piece of the CAPM formula. Beta measures how volatile a specific stock is compared to the overall market. By definition, the market (e.g., the S&P 500) has a beta of 1.0.
A beta > 1.0 means the stock is more volatile than the market. Think of a high-growth tech startup with a beta of 1.5—it's expected to swing 50% more than the market, up or down.
A beta < 1.0 means the stock is less volatile. A stable utility company, for instance, might have a beta of 0.7.
You can find a company's historical beta on platforms like Yahoo Finance, Bloomberg, or Refinitiv. But here’s the catch: raw historical beta is backward-looking, and we care about the future.
This is why professionals almost always use an adjusted beta. Data providers calculate this by regressing the raw beta toward the market average of 1.0, which accounts for the statistical tendency of betas to revert to the mean over time. A common adjustment formula, used by Bloomberg, is (⅔ × Raw Beta) + (⅓ × 1.0). It’s a simple way to smooth out extreme historical data and get a more stable, forward-looking estimate. This technique was used in a detailed analysis of Apple, where an adjusted beta of 1.17 helped produce a much more defensible WACC.
It’s a small tweak, but using an adjusted beta adds a layer of professional rigor that separates a good analysis from a great one.
Calculating the After-Tax Cost of Debt
While the cost of equity requires a bit of detective work with CAPM, figuring out the cost of debt (Rd) feels more straightforward. After all, debt comes with an interest rate spelled out right there in the loan agreement.
But here’s a classic mistake: don't just grab the "coupon" rate from the balance sheet. That number can be years old and totally misrepresent what it would cost the company to borrow money today. Relying on it will throw off your entire WACC calculation.
The number you're actually after is the company's current cost of borrowing in today's market. The gold standard for this is the Yield to Maturity (YTM) on the company's existing long-term debt. YTM is the total return bondholders expect if they hold the bond to maturity, and it's the market's real-time assessment of the company's credit risk.
This forward-looking view is essential because WACC is all about evaluating future projects. You need to know what it would cost to raise debt now, not what it cost five years ago.
Finding the Cost of Debt in the Real World
For big public companies with bonds trading on the open market, finding the YTM is a breeze. Financial terminals like a Bloomberg Terminal or platforms from Refinitiv will give you this data directly. It’s a clean, market-driven estimate.
But what if the company is private or doesn’t have publicly traded bonds? You have to get a little creative. Here are the best ways to find a reliable proxy for the cost of debt:
Recent Loan Agreements: If the company just took out a major bank loan, the interest rate on that loan is an excellent stand-in for its current borrowing cost. It's fresh and reflects current market conditions.
Credit Rating Analysis: Check the company's credit rating from agencies like Moody's or S&P. You can then look up the average yield for bonds with a similar rating and maturity. This is a very common and defensible approach in the industry.
Synthetic Credit Rating: No official rating? No problem. You can create a "synthetic" one. This involves digging into the financials to calculate ratios like the interest coverage ratio (EBIT / Interest Expense) and comparing them to industry tables that map these ratios to specific credit ratings and default spreads.
The goal is always to find the most accurate reflection of the company's current, marginal cost of borrowing. It’s always better to use a slightly more conservative estimate based on today’s market than to pull an outdated number from an old financial statement.
The Power of the Tax Shield
Here’s where debt financing really shines. The interest a company pays on its debt is tax-deductible. This "tax shield" effectively lowers the true cost of debt—a massive advantage that equity financing (like paying dividends) just doesn't offer.
To capture this benefit, you have to calculate the after-tax cost of debt. The formula is simple but incredibly important:
After-Tax Cost of Debt = Rd × (1 – Tc)
Here, Rd is your pre-tax cost of debt (the YTM or your best estimate), and Tc is the corporate tax rate.
Let’s say a company's cost of debt is 6% and its corporate tax rate is 21%. Its after-tax cost of debt isn't 6%. It’s actually 4.74%, calculated as 6% × (1 - 0.21).
That 1.26% difference might look small, but when applied to millions or billions of dollars in debt, the impact is huge. It directly lowers the overall WACC, which in turn boosts the present value of future cash flows and leads to a higher company valuation. Forgetting to apply the tax shield is one of the most fundamental mistakes you can make when calculating WACC.
Using Market Values to Weight Equity and Debt
Alright, you've got your cost of equity and the after-tax cost of debt. Now comes the part where we blend them together. The "weighted average" in WACC isn't just fancy talk—it means you need to figure out how much of the company's funding comes from equity versus debt.
This is where a lot of people make a huge, yet common, mistake.
They’ll just pull the book value of equity and debt straight from the balance sheet. Don't do this. Book values are historical. They tell you what capital was worth when it was first raised, not what it's worth today. WACC is a forward-looking metric, so you absolutely must use current market values.
How to Calculate the Market Value of Equity
This is the easy part, at least for a public company. The market value of equity is just its market capitalization. Simple as that.
The formula is straightforward:
Market Value of Equity = Current Share Price × Total Shares Outstanding
So if a company’s stock is trading at $150 per share and it has 500 million shares outstanding, its market value of equity is $75 billion. This number is the market's real-time consensus on what the company's equity is worth. You can find the latest shares outstanding in the company's 10-K or 10-Q filing.
Determining the Market Value of Debt
Figuring out the market value of debt takes a little more legwork. The number you see on the balance sheet is its book value, and that can be misleading, especially if interest rates have moved since the debt was issued.
Here’s how to handle it properly:
For Publicly Traded Bonds: If the company’s bonds are publicly traded, you can look up their current market prices on a terminal like Bloomberg or through public data sources. The total market value is the sum of all outstanding bonds trading at their current price. This is the gold standard for accuracy.
For Bank Debt or Private Bonds: When there's no public market price, you have to estimate. The most common approach is to treat the company’s debt portfolio as a single, giant bond. You'll need to find the weighted average coupon rate and maturity from the company's debt schedule (usually in the footnotes of the 10-K). Then, you discount the future cash flows (interest payments and principal) back to today using the company's current cost of debt (Rd).
A Practical Shortcut: Look, in many real-world scenarios, if the company's credit rating hasn't changed much and interest rates have been pretty stable, the book value of debt can be a decent proxy for its market value. It's not perfect, but it's often close enough. Just be prepared to defend this assumption. If rates have swung wildly, you need to do the full market value calculation.
Putting It All Together for Capital Weights
Once you have the market value of equity (E) and the market value of debt (D), you can calculate the total enterprise value of the firm (V).
V = E + D
Now you have everything you need to calculate the capital weights for the WACC formula. These weights are simply the proportion of the company's financing that comes from each source.
Weight of Equity (E/V): This is the market value of equity divided by the firm's total value.
Weight of Debt (D/V): This is the market value of debt divided by the firm's total value.
Let's go back to our company with the $75 billion market cap. We'll assume we’ve calculated (or estimated) the market value of its debt to be $25 billion.
Total Value (V): $75B (E) + $25B (D) = $100 billion
Weight of Equity (E/V): $75B / $100B = 75%
Weight of Debt (D/V): $25B / $100B = 25%
These two percentages—75% for equity and 25% for debt—are the weights you'll plug into your final WACC formula. Using market-based weights ensures your WACC actually reflects the company's true economic reality today.
A Real-World WACC Calculation Walkthrough
Theory is great, but let's get our hands dirty. The best way to really understand WACC is to calculate it from scratch. We'll walk through a practical example for a fictional public company, "Global Innovations Inc.," using realistic market data to tie it all together.
This will connect all the dots we've discussed: finding the cost of equity with CAPM, figuring out the after-tax cost of debt, and weighting everything correctly using market values.
Gathering Our Key Assumptions
First things first, we need to round up our inputs. For any real-world analysis, you'd pull this data from financial terminals (like Bloomberg or FactSet), company filings (the 10-K), and market data providers.
Here are the assumptions we'll use for Global Innovations:
Risk-Free Rate (Rƒ): We'll peg this to the current yield on the 10-year U.S. Treasury note, which we'll call 4.0%.
Equity Risk Premium (ERP): Let's use a standard, defensible ERP of 5.5%. This is a common baseline in the industry.
Adjusted Beta (β): After looking at comparable companies and market data, we've determined Global Innovations has an adjusted beta of 1.2.
Corporate Tax Rate (Tc): We'll use the U.S. federal corporate tax rate of 21%.
These inputs are the bedrock of the calculation. Keep in mind that a small tweak to beta or the ERP can have a big impact on the final WACC.
Calculating the Cost of Equity
With our assumptions in hand, the first big piece of the puzzle is the cost of equity (Re). We'll use the Capital Asset Pricing Model (CAPM) for this.
The formula is straightforward: Re = Rƒ + β * (ERP)
Let’s plug in our numbers:
Re = 4.0% + 1.2 * (5.5%)
Re = 4.0% + 6.6%
Re = 10.6%
So, the cost of equity for Global Innovations is 10.6%. This is the return that the company's shareholders expect for taking on the risk of owning its stock.
Finding the After-Tax Cost of Debt
Next up is debt. We'll dig into the company's annual report (the 10-K) and find that the yield to maturity (YTM) on its long-term bonds is 6.0%. This serves as our pre-tax cost of debt (Rd).
But we get a tax break on interest payments. This "tax shield" makes debt a cheaper source of capital because the interest is tax-deductible.
Here's how we adjust for it: After-Tax Cost of Debt = Rd * (1 – Tc)
After-Tax Cost of Debt = 6.0% * (1 - 0.21)
After-Tax Cost of Debt = 6.0% * 0.79
After-Tax Cost of Debt = 4.74%
See how that tax shield knocked the effective cost down from 6.0% to just 4.74%? This is a critical step that analysts sometimes forget.
Determining the Capital Structure Weights
Now it's time to figure out the "weights" for our weighted average. This is all about the market values of equity and debt—not the book values you see on the balance sheet. Getting this right is crucial, and it all starts with understanding how the three financial statements link together.
For Global Innovations, let's assume we found the following:
Shares Outstanding: 1 billion shares
Current Share Price: $50.00 per share
Market Value of Debt: $20 billion (this would be based on the current market price of its bonds, not the face value)
With this info, we can calculate the market value of equity and the total value of the firm.
Market Value of Equity (E): 1 billion shares * $50.00/share = $50 billion
Market Value of Debt (D): $20 billion
Total Firm Value (V): $50 billion (E) + $20 billion (D) = $70 billion
This process is what determines the actual capital weights.
Now that we have the total value, calculating the proportions is simple:
Weight of Equity (E/V): $50B / $70B = 71.4%
Weight of Debt (D/V): $20B / $70B = 28.6%
Bringing It All Together to Calculate WACC
We’ve done all the heavy lifting. Now we have every input we need for the WACC formula. It's time to plug and chug.
WACC = (E/V * Re) + (D/V * Rd * (1 – Tc))
Let's drop in our final numbers for Global Innovations:
WACC = (71.4% * 10.6%) + (28.6% * 4.74%)
WACC = 7.57% + 1.36%
WACC = 8.93%
And there you have it. The WACC for Global Innovations is 8.93%. This table neatly summarizes every step we just took.
This number is the blended cost of capital for the company. It represents the minimum return Global Innovations must earn on its investments to keep both its shareholders and its lenders happy. Any project with an expected return below this hurdle rate would destroy value, while anything above it should, in theory, create value.
Common WACC Questions Answered
Once you've got the WACC formula down, you'll start running into the tricky real-world questions that separate the textbook answer from what happens on the job. Things aren't always clean. Companies don't fit into neat little boxes.
Let's dig into some of the most common curveballs you'll see. Nailing these nuances is what separates a good answer from a great one in a high-stakes interview. It proves you understand the why, not just the what.
Why Use Market Value Instead of Book Value for WACC?
This is a huge one, and it trips up more people than you’d think. The answer comes down to one core idea: WACC is a forward-looking metric. We use it to decide whether a future project or investment is worth it.
Because of that, every single input has to reflect today's economic reality, not what's on the old accounting books.
Market Value is what investors believe the company's equity and debt are worth right now. It's live, dynamic, and captures the market's current perception of risk and future growth.
Book Value is just a historical record. It tells you what an asset was purchased for years ago, which is totally irrelevant for making a decision about the future.
Using book value is like trying to drive a car by only looking in the rearview mirror. It gives you a warped WACC that will lead to bad investment decisions. In any analysis, you have to be able to defend your assumptions, and using market values is always the most defensible approach.
What Happens If a Company Has Preferred Stock?
You'll see preferred stock pop up often, especially with established companies in sectors like banking or utilities. It's a hybrid between debt and equity, and you absolutely cannot ignore it.
If a company has preferred stock on its balance sheet, you just need to add one more piece to the WACC formula.
The expanded formula looks like this:
WACC = (E/V * Re) + (D/V * Rd * (1 – Tc)) + (P/V * Rp)
Here’s the breakdown of the new terms:
P: The market value of the company’s preferred stock.
V: The total market value of the firm, which is now E + D + P.
Rp: The cost of preferred stock.
Figuring out the cost of preferred stock (Rp) is usually pretty simple. You just take the annual preferred dividend and divide it by the current market price of a preferred share. One key difference: preferred dividends aren't tax-deductible for the company, so there's no tax shield adjustment needed here.
How Do You Calculate WACC for a Private Company?
This is a classic interview question that moves into more advanced territory. A private company doesn't have a stock price, so you can't just look up its market cap or beta. This is where you have to put on your analyst hat and make a smart estimate using comparable company analysis.
Here’s how the process works:
Find Public Comps: First, you build a list of publicly traded companies that are as similar as possible to your private company—think industry, size, and business model.
Unlever the Betas: For each of those public companies, you find its equity beta and "unlever" it. This is a crucial step where you strip out the effects of each company's unique debt level, leaving you with an "asset beta" that reflects the pure, underlying business risk of that industry.
Average and Re-lever: You then take the average (or median) unlevered beta from your peer group. Now, you "re-lever" this average asset beta using the private company's specific target capital structure (its own debt-to-equity ratio).
Calculate WACC: The re-levered beta you just created is your proxy for the private company's equity beta. From here, you can plug it into the CAPM formula to get your cost of equity and finish the rest of the WACC calculation as you normally would.
This method allows you to build a defensible beta from actual market data, even when your target company doesn't have any. A deep understanding of this process is critical, especially when you get hit with technicals in an interview. To get sharp on these scenarios, check out our guide on the four types of technicals asked in investment banking interviews.
Ready to stop memorizing and start mastering the technicals that win offers? AskStanley AI provides an infinite supply of realistic technical questions, mock interviews, and adaptive drills designed specifically for investment banking candidates. Track your progress, identify your weak spots, and get the reps you need to walk into your interviews with total confidence. Join the hundreds of users who have landed top offers with AskStanley today.