Understand calculate discounted payback period: A Practical Guide for Investors

To figure out the discounted payback period, you’re looking for the exact moment when the present value of a project's future cash inflows cancels out the initial investment. This is a huge step up from the simple payback period because it factors in the time value of money, giving you a much more realistic breakeven timeline.
What the Discounted Payback Period Actually Tells You
Before we jump into any formulas, let's get clear on what this metric really tells you about an investment. It's not just a breakeven point; it’s a realistic gauge of how long it takes to get your initial cash back in today's money. That distinction is everything, and it's the core difference between this method and its simpler cousin, the standard payback period.
Why Time Value of Money Is Non-Negotiable
Ignoring the time value of money—the idea that a dollar today is worth more than a dollar tomorrow—is a rookie mistake. The standard payback period treats all future cash inflows as if they’re created equal, which just isn't true. Inflation chips away at purchasing power, and any cash you're waiting on has an opportunity cost since it's not invested elsewhere.
The discounted payback period fixes this by bringing all future earnings back to their present value. It's a smarter capital budgeting tool that tells you how long it takes for the discounted cash inflows to recoup your initial investment. Unlike the simple payback period, which just adds up raw cash flows, this method uses a discount rate to adjust for risk and time. For more on this, wallstreetprep.com has some great resources on capital budgeting methods.
Key Takeaway: The discounted payback period is your conservative, risk-adjusted metric. It gives you a more cautious estimate of when you'll get your money back, making it an invaluable tool for sizing up a project's liquidity and risk.
A Practical Comparison
Let’s imagine you're looking at two different projects:
Project A: A long-term equipment upgrade that costs $200,000. It promises big returns down the line, but you won't see them for three to five years.
Project B: A quick software subscription for $50,000. It offers smaller, but immediate, cash flow bumps starting next month.
The simple payback period might make Project A look better because the raw cash flow numbers are bigger. But the discounted method properly weighs the immediate, lower-risk returns of Project B against the delayed, higher-risk returns of Project A.
It forces you to answer the real question: how long until I get my actual money back, once I account for risk? This kind of thinking is essential for anyone dealing with financial reports. To get a better handle on these concepts, check out our guide where we walk you through the 3 financial statements.
Breaking Down the Discounted Payback Period Formula
Before you can crunch the numbers for a discounted payback period, you need to get your head around the logic. There isn't a simple, one-size-fits-all formula you just plug numbers into. Instead, it’s a process—a series of steps built on a few core inputs. Get these right, and you're halfway there.
Let's pull back the curtain on the variables that really matter. Each one tells a crucial part of your project's financial story.
The Key Ingredients for Your Calculation
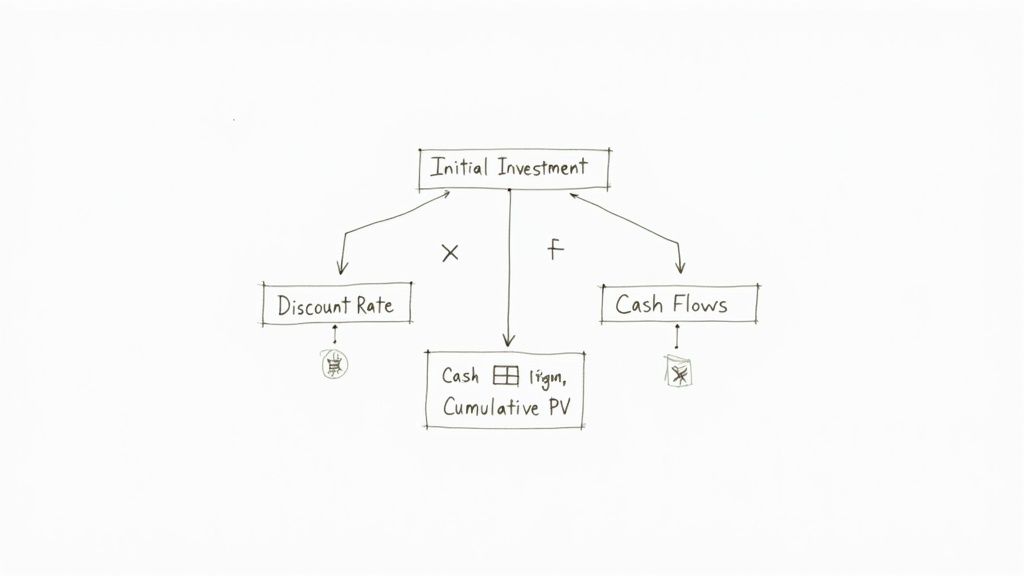
At its core, the calculation is a comparison: you're weighing your initial cash outlay against the present value of all the cash that comes back in. To do this, you need to nail down three key pieces of information.
Initial Investment (Year 0): This is the total cash you spend upfront to get the project off the ground. Think of it as a negative number at the very start of your timeline.
Cash Flow per Period (CF): This is the net cash your project is expected to bring in during each period, usually on an annual basis. Getting these forecasts as accurate as possible is absolutely critical.
Discount Rate (r): This is the interest rate you use to figure out what those future cash flows are worth today. It’s your way of accounting for risk and the time value of money.
These three elements work together to shrink future earnings down to their present-day value. The entire goal is to pinpoint the exact moment when the running total of these discounted cash flows finally cancels out your initial investment.
To make it crystal clear, here’s a quick breakdown of the variables you'll be working with.
Key Variables in the Discounted Payback Calculation
Variable | Description | Example |
|---|---|---|
Initial Investment | The total cash paid upfront for the project (a negative value). This is the amount you need to "pay back." | -$100,000 for new machinery. |
Cash Flow per Period (CF) | The expected net cash generated by the project in a specific period (e.g., Year 1, Year 2). | $30,000 in net cash generated in the first year. |
Discount Rate (r) | The rate used to adjust future cash flows to their present value, reflecting risk and opportunity cost. | A 10% WACC or a project-specific hurdle rate. |
Period (t) | The specific time period (usually a year) in which the cash flow is received. | The cash flow in Year 3 (t=3). |
Discounted Cash Flow (DCF) | The present value of a future cash flow, calculated as CF / (1 + r)^t. | A $30,000 cash flow in Year 1 discounted at 10% is $27,273. |
Understanding each variable's role is fundamental. The discount rate, in particular, requires some careful thought.
How to Choose a Realistic Discount Rate
Picking the right discount rate is probably the most important—and most subjective—part of this whole exercise. If your rate is too low, you'll make future cash flows look more valuable than they really are, understating the project's risk. Go too high, and you might kill a perfectly good investment on paper before it even gets a chance.
A great starting point is the company’s Weighted Average Cost of Capital (WACC). The WACC tells you the average return a company needs to generate to satisfy all its investors, both debt and equity holders. It’s a solid baseline for what any new project should be expected to earn.
But don't stop there. You should always adjust that baseline to reflect the specific risks of the project you're looking at. A project involving a new, untested market should probably have a higher discount rate than a simple upgrade to machinery you already know well.
A thoughtfully chosen discount rate is what separates a basic calculation from a credible risk analysis. It forces you to account for both time and uncertainty, which is the whole point of using the discounted payback method in the first place.
The Logical Framework of the Calculation
Once you have your inputs, you can map out the calculation. The process is pretty straightforward: you discount each period's cash flow, one by one, and keep a running total until you've recovered your initial investment.
Think of it like this: you're trying to fill a bucket (your investment) with water from a hose (your cash flows). But because of the discount rate, the water pressure gets a little weaker the further into the future you go.
In the next sections, we'll walk through exactly how this works with some concrete examples for both even and uneven cash flows.
Alright, let's walk through an example. Theory is great, but seeing the numbers in action is how you really get a feel for this stuff, especially for a finance interview.
We'll use a straightforward scenario: your company is thinking about buying a new machine for $100,000. The forecast says this machine will bring in an extra $30,000 in cash each year for the next five years. To make a smart decision, we'll apply a 10% discount rate to account for the time value of money and the project's risk.
Breaking Down the Calculation
First things first, we can't just add up the future cash flows. A dollar next year isn't worth a dollar today. We have to discount each of those $30,000 payments back to its present value (PV).
The formula for this is a classic:
PV = Cash Flow / (1 + Discount Rate)^Year
For Year 1, we’d calculate $30,000 / (1 + 0.10)^1, which comes out to $27,272.73. We'll do this for every single year, with the exponent climbing from 1 to 5. This is the core of the entire discounted payback calculation.
Once we have the present value for each year's cash flow, we'll keep a running total. This cumulative figure tells us, in today's dollars, how much of that initial $100,000 we've clawed back.
Pinpointing the Breakeven Point
Laying this out in a table is the best way to see what's happening. It’s also exactly how you should present it in an interview—it shows you’re organized and think logically.
Year | Annual Cash Flow | Discounted Cash Flow (DCF) | Cumulative DCF |
|---|---|---|---|
0 | -$100,000 | -$100,000 | -$100,000 |
1 | $30,000 | $27,272.73 | -$72,727.27 |
2 | $30,000 | $24,793.39 | -$47,933.88 |
3 | $30,000 | $22,539.44 | -$25,394.44 |
4 | $30,000 | $20,490.40 | -$4,904.04 |
5 | $30,000 | $18,627.64 | $13,723.60 |
Look at the table. At the end of Year 4, we’re still in the red by $4,904.04. But by the end of Year 5, we've swung into the positive. This tells us our breakeven point happens sometime during Year 5. Our payback period is between 4 and 5 years.
To get the exact answer, we have to figure out what fraction of that fifth year it takes to cover the remaining deficit. This is the kind of precision that impresses interviewers.
Here’s the simple formula to nail down that partial year:
Partial Year = Unrecovered Amount at Start of Year / DCF of the Following Year
Let's plug in our numbers: $4,904.04 / $18,627.64 = 0.263 years.
Add that to the last full year, and you get your answer. The discounted payback period is 4 + 0.263 = 4.26 years. In plain English, it'll take about four years and three months to get our initial $100,000 back in today's money.
Calculating Payback with Uneven Cash Flows
Real-world projects rarely spit out nice, even streams of income. That's just not how business works. More often, you're looking at uneven cash flows—maybe a slow start in year one followed by a huge jump once a new product catches on.
Learning to calculate the discounted payback period with these fluctuating returns is a must-have skill. While the core idea is the same, the mechanics get a little more hands-on.
It all boils down to the same three steps: invest the initial capital, discount each of the future cash flows back to today's value, and then figure out when you've recovered your outlay.
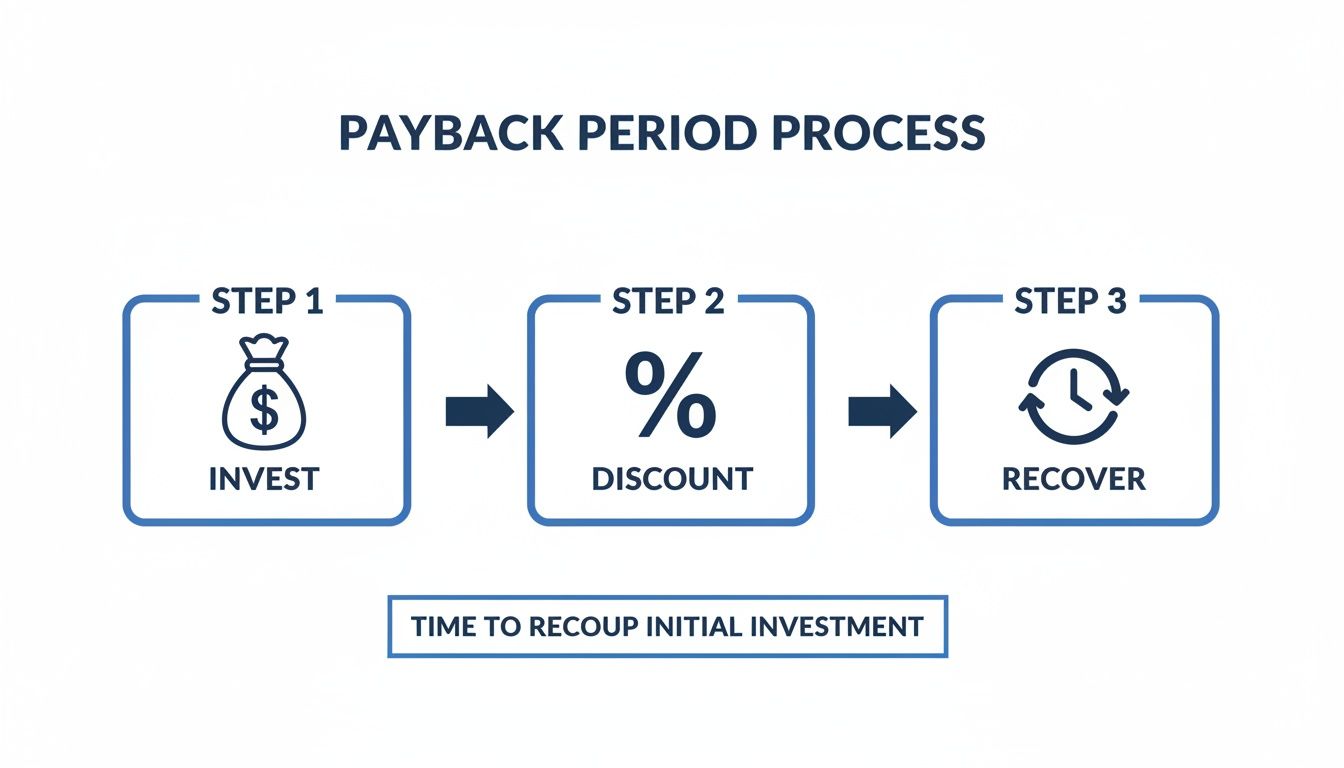
This simple flow—invest, discount, recover—is the bedrock of the analysis. It keeps the logic straight when the numbers get messy.
A Practical Example with Fluctuating Returns
Let's walk through a common scenario. Imagine a tech startup sinks $250,000 into developing a new app. Given the risk, they're using a 12% discount rate to evaluate the project.
Their forecasted net cash inflows are anything but steady:
Year 1: $50,000
Year 2: $75,000
Year 3: $120,000
Year 4: $150,000
Year 5: $100,000
Our job is to discount each of these cash flows individually, then track the running total until we hit the breakeven point. This is exactly the kind of analysis you'll see in real-world investment banking case studies.
First, we need to find the present value for each year's expected income using the standard formula: DCF = Cash Flow / (1 + r)^t.
Building the Payback Table
The easiest way to keep all this straight is with a simple table. We'll track each year's discounted cash flow (DCF) and the cumulative recovery balance.
Year | Annual Cash Flow | Discounted Cash Flow (DCF) | Cumulative DCF |
|---|---|---|---|
0 | -$250,000 | -$250,000 | -$250,000 |
1 | $50,000 | $44,642.86 | -$205,357.14 |
2 | $75,000 | $59,795.92 | -$145,561.22 |
3 | $120,000 | $85,404.52 | -$60,156.70 |
4 | $150,000 | $95,326.68 | $35,169.98 |
5 | $100,000 | $56,742.69 | $91,912.67 |
Take a look at the table. At the end of Year 3, we're still in the red by $60,156.70. But by the end of Year 4, our cumulative balance flips to positive. This is our signal: the breakeven point happens sometime during Year 4.
Finding the Precise Payback Period
Now we just need to pinpoint exactly when in Year 4 we get our money back. We do this by figuring out what fraction of that year's cash flow is needed to cover the remaining deficit from Year 3.
The formula for this partial year is pretty intuitive:
Partial Year = Unrecovered Amount at Start of Year / DCF of the Following Year
Let's plug in our numbers: $60,156.70 / $95,326.68 = 0.631 years.
We're almost there. Just add this fraction to the last full year before recovery, which was Year 3.
The final discounted payback period is 3 + 0.631 = 3.63 years. This tells the startup it will recover its risk-adjusted investment in roughly three years and seven-and-a-half months. This is the kind of specific, actionable answer needed to make smart capital budgeting decisions.
Figuring out the discounted payback period is one thing, but that number is pretty useless without context. The real skill is knowing what that result actually means for the business—and sidestepping the common traps that catch people out.
So, you’ve run the numbers and landed on, say, 3.6 years. Is that good? Bad? The honest answer is: it depends entirely on your industry, risk tolerance, and the project's strategic goals.
A high-risk venture into a new market might demand a rapid payback of under two years. On the other hand, a stable, long-term infrastructure project could be perfectly fine with a five or six-year payback period. It's all about perspective.
For instance, in the hyper-competitive Software as a Service (SaaS) world, the median Customer Acquisition Cost (CAC) payback is around 16 months. But the top-tier companies? They're aiming for under 12 months to keep cash flow healthy and stay ahead. Checking out these SaaS benchmarks shows just how much industry standards can shape what "good" looks like.
What Does a "Good" Payback Period Look Like?
Defining a solid payback period isn’t about finding a magic number. It’s about making sure the result lines up with your company’s specific financial game plan.
A few factors really drive this decision:
Risk Appetite: Companies that hate uncertainty will push for much shorter payback periods. They want their capital back in their hands fast, minimizing how long it's exposed to market swings.
Industry Norms: Some industries, like manufacturing, are capital-intensive and just plain used to longer payback horizons. Tech, however, moves at lightning speed and prizes quick returns on investment.
Capital Availability: If cash is tight, a project with a shorter payback might win out over a more profitable one with a longer payback. Why? Because it frees up precious capital sooner for the next move.
At the end of the day, the shorter the discounted payback period, the less risky the project is generally considered to be. It signals a quicker return of your initial investment, which boosts liquidity and cuts down the time your money is at risk.
The One Limitation You Absolutely Cannot Ignore
Here’s the biggest pitfall of the discounted payback period: it’s incredibly shortsighted.
This metric is built to answer only one question: "When do I get my initial investment back?" It completely, totally, and utterly ignores every single dollar of cash flow that comes in after that breakeven point.
Think about it. Project A could have a fantastic payback period of two years but generate tiny profits from years three to ten. Meanwhile, Project B might take three years to pay back but then produce massive, sustained cash flows for a decade. If you only looked at the payback period, you’d likely choose the inferior investment.
This is exactly why you should never rely on the discounted payback period by itself. It's a fantastic tool for gauging risk and liquidity, but it is not a measure of profitability.
To get the full financial story, you have to pair it with other capital budgeting heavyweights:
Net Present Value (NPV): This tells you the total value a project is expected to add to the company, measured in today's dollars.
Internal Rate of Return (IRR): This calculates the project's expected annualized rate of return, giving you a sense of its overall profitability.
Common Questions About the Discounted Payback Period
Even after you’ve run the numbers, a few questions always seem to pop up. This is especially true if you’re prepping for interviews where a crisp, confident answer makes all the difference. Let’s clear up the common sticking points so you’re ready for them.
The big one is always, "How is this different from Net Present Value (NPV)?" It’s a great question. While both metrics rely on discounted cash flows, they’re asking two completely different things.
Discounted payback period tells you when you get your initial investment back in today's dollars. It’s a measure of risk and liquidity. NPV, on the other hand, tells you how much total value the project is expected to create over its entire life. It’s a measure of pure profitability. A project can have a fantastic payback period but a mediocre NPV, and vice-versa.
Does a Shorter Payback Period Always Mean a Better Project?
Not at all. This is a classic trap. While a shorter payback period feels safer—and often signals lower risk—it’s an incredibly shortsighted metric. Why? Because it completely ignores every single dollar a project generates after it hits the breakeven point.
Think about it. A project with a two-year payback might just trickle cash after that. But another project with a four-year payback could be an absolute cash cow for the next decade. If you only looked at the payback period, you’d pick the less profitable project every time.
Key Insight: The discounted payback period is a tool for assessing risk and liquidity, not a definitive measure of profitability. Always use it alongside NPV and IRR for a complete financial picture.
How Do You Handle Negative Cash Flows in Later Years?
This is a smart, real-world question. Projects aren't always a simple story of one investment followed by years of positive returns. What if a project requires a major equipment overhaul in Year 4, causing a negative cash flow?
You handle it just like any other cash flow. You discount that future negative outflow back to its present value and subtract it from your cumulative total for that year.
This can get interesting. You might find a project has multiple payback periods—a scenario where you break even, then the new investment pushes you back into the red, and you have to break even all over again. It’s a perfect example of why you need to forecast the entire project lifecycle, not just the first few years. This kind of complexity is exactly what interviewers test for in advanced investment banking technical questions.
Ultimately, knowing how to calculate discounted payback period isn't just about plugging numbers into a formula. It’s about understanding what the result tells you—and, more importantly, what it doesn't.
Ready to master every technical concept for your interviews? AskStanley AI provides infinite, AI-powered mock interviews and drills to ensure you can answer any question with confidence. Stop memorizing and start mastering at https://www.askstanley.ai.