
Ultimate Guide to Change in Working Capital

Think of change in working capital as an operational traffic light. It shows how receivables, inventory, and payables lock up—or free—your cash between balance-sheet dates.
At its core, this metric isolates day-to-day cash flow from financing moves like new debt or equity.
Quick Answer On Change In Working Capital
Here’s the formula to nail down the change in working capital for any period:
∆WC = (Receivables_end − Receivables_start) + (Inventory_end − Inventory_start) − (Payables_end − Payables_start)
Receivables shift tells you how much cash is tied up or released
Inventory movement shows if you’re stocking up or drawing down
Payables change reflects whether you’re speeding up or delaying payments
How Change In Working Capital Affects Cash Flow
The table below breaks down what happens to cash when each component moves.
Component | When It Increases | When It Decreases |
|---|---|---|
Accounts Receivable | Cash Outflow | Cash Inflow |
Inventory | Cash Outflow | Cash Inflow |
Accounts Payable | Cash Inflow | Cash Outflow |
These simple rules help you spot cash pressure or relief at a glance.
Behind every swing is real cash at work. A recent analysis by The Hackett Group found simultaneous stretches in DSO, DIO, and DPO across 1,000 large U.S. firms carved out a $1.76 trillion hole in untapped working capital—costing tens of billions in annual financing costs. Dive deeper in the Hackett Group report.
Change in working capital isolates operational cash flows from financing noise. It’s a quick health check on how efficiently you turn stock into sales and invoices into collected cash.
In budgeting, you map out capital needs based on expected working-capital swings
In forecasting, realistic receivables and payables trends sharpen cash projections
In valuation, accurate working-capital forecasts ensure free-cash-flow figures aren’t overstated
Key Highlights
Alerts you when operations consume cash versus release it
Focuses solely on non-cash shifts in current assets and liabilities
Guides critical decisions in budgeting, forecasting, and valuation
Change in working capital measures cash friction in operations and drives forecasting accuracy.
Next Steps
We’ll dive into detailed line-item calculations and period-over-period differences
Next up: hands-on examples from a retailer and a manufacturer
Then we integrate change in working capital into cash flow and DCF models
Finally, practice problems and common pitfalls to sharpen your modeling toolkit
Stick around for bonus tips on avoiding common mistakes
Understanding the Key Concepts
Think of working capital as the fuel tank that keeps your business moving day to day. By watching how cash flows into and out of that tank, you’ll know exactly when you need to refill.
Current assets are items you expect to turn into cash within a year—accounts receivable, inventory, prepaid expenses. Current liabilities are short-term bills coming due soon, like accounts payable and accrued expenses.
Fuel Tank Components
Accounts Receivable: Invoices you’ve sent but haven’t collected on yet.
Inventory: Products sitting on shelves or in the warehouse.
Accounts Payable: Bills you haven’t paid, so you hold onto cash a bit longer.
Accrued Expenses: Costs you’ve incurred but haven’t cut a check for by period end.
We strip out cash and short-term debt from working capital to isolate the money truly tied to operations. That way, you see the pure cycle of cash in and out.
For example, if accounts receivable go up, more cash is blocked by customers. If payables rise, you keep cash in your pocket longer.
How Receivables Inventory Payables Operate
When receivables climb, cash is pending collection, which feels like a temporary outflow.
When inventory builds up, money sits in stock instead of fueling other needs.
When payables increase, you delay payments and preserve cash.
Every industry has its own rhythm. A grocery store might sell through stock in days, whereas a heavy-equipment manufacturer could wait months for a sale.
KPMG’s market analysis of 2,700 U.S. public companies shows the Cash Conversion Cycle rose from 83 days in 2020 to 90 days in 2023. Small firms carried a 120-day burden in 2024 versus 65 days for large companies. You can dive deeper in KPMG’s Working Capital Trends Report (2025).
Sector Differences And Cycles
Small businesses juggle tight margins and fewer financing options, so every extra day in the cycle really hurts. Larger companies, by contrast, can negotiate extended terms and speed up collections.
Tracking these cycles uncovers hidden cash risks or chances to optimize. Spot a trend early, and you might adjust production schedules, tweak credit policies, or shift payment timing to unlock funds.
Monitoring your conversion cycles gives a clear window into operational health and shows where you can reclaim or conserve cash.
Now, understanding the change in working capital takes those insights and turns them into numbers. You’ll see exactly how shifts in assets and liabilities feed into free cash flow forecasts.
You might find How the Three Financial Statements Fit Together a helpful primer before jumping into the calculations.
This groundwork sets you up to map balance-sheet line items into a structured model and observe real-world cash flow impacts step by step.
Key Takeaway
Working capital is the cash buffer that keeps daily operations running.
Watching receivables, inventory, and payables highlights where money is parked.
Shortening conversion cycles or tweaking each component boosts free cash flow.
Calculating change in working capital quantifies those operational cash impacts.
Keep these ideas handy—they’ll guide you as you build your working capital model.
Computing Change In Working Capital
When you want to see how much cash your day-to-day operations swallow or free up, the first move is simple: pull two consecutive balance sheets and zero in on the working-capital accounts.
Think of accounts receivable, inventory, accounts payable, and accruals as the engine room of your short-term liquidity. Leave cash and short-term debt on the sidelines—they don’t tell you much about operational cash turns.
Once you’ve isolated those numbers, you can pinpoint exactly how your routine business activities either release funds into your pocket or lock them away again.
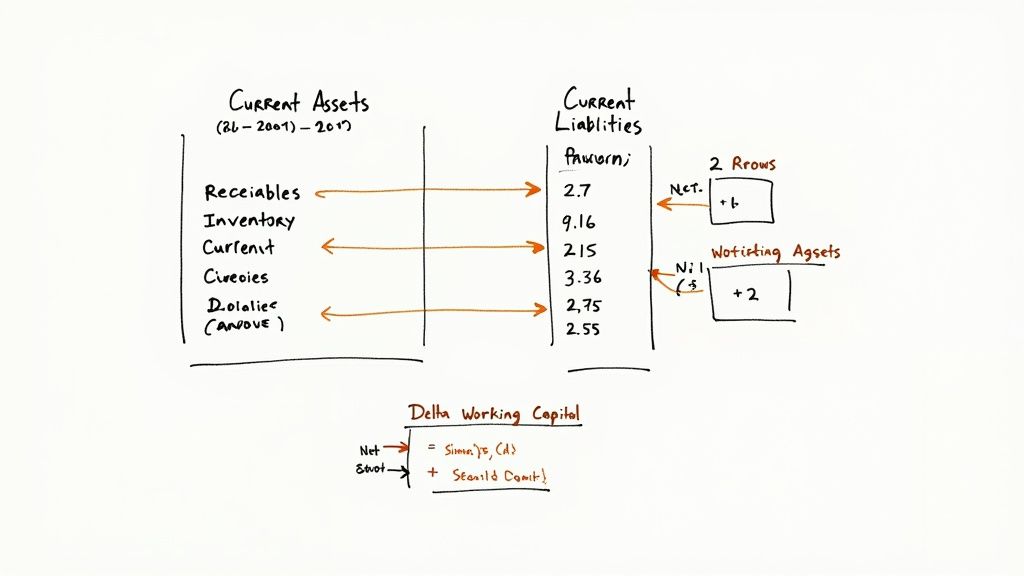
This infographic walks you through every step, from scooping out the right line items to spotting pure working-capital shifts.
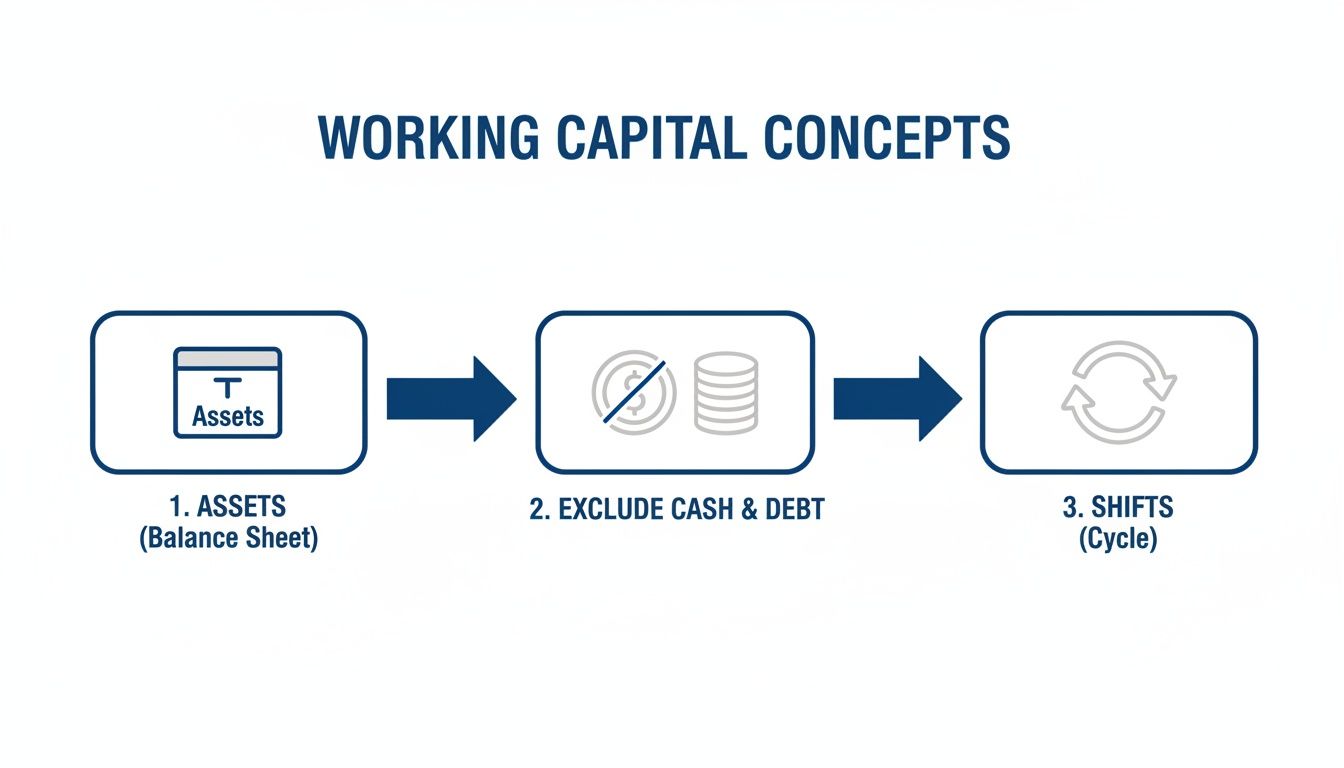
It shows how you start with total current assets, strip out cash and debt, then compare each period’s movements to reveal real liquidity trends.
Identify Balance Sheet Items
Accounts Receivable tracks what customers owe you at period end.
Inventory represents stock you’ve paid for but haven’t sold yet.
Accounts Payable is money you owe suppliers—higher payables mean you’re holding onto cash longer.
Accruals are expenses recognized before you actually write a check.
Grab these figures straight from the current assets and liabilities section of your balance sheet. They form the bedrock of any accurate working-capital analysis.
Calculate Period-Over-Period Differences
Subtract the opening balance from the closing balance for each of those accounts. A rise in an asset account signals cash outflow; a rise in a liability account signals cash inflow.
Steps to follow:
Pull beginning and ending balances for each working-capital component.
Compute the net change: (Ending − Beginning).
Apply signs: increases in assets are outflows; increases in liabilities are inflows.
For instance: ∆WC = (AR_end − AR_start) + (Inv_end − Inv_start) − (AP_end − AP_start). This equation lays out how each asset uptick uses cash and each liability uptick conserves it.
Map Adjustments To Cash Flow
Next, drop each ∆WC figure into the operating section of your cash flow statement. This step turns those balance-sheet movements into actual cash-flow line items.
Always compare the same period lengths (month, quarter, year) for consistency.
Exclude non-operating items like cash equivalents or short-term borrowings.
Reconcile any large swings to footnotes if accounting policies shifted.
Below is a quick overview of how increases or decreases in receivables, inventory, and payables affect your operating cash flow:
Impact Of Balance Sheet Changes On Cash Flow
Balance Sheet Item | Increase Effect | Decrease Effect |
|---|---|---|
Accounts Receivable | Cash outflow (uses cash) | Cash inflow (frees cash) |
Inventory | Cash outflow (ties up cash) | Cash inflow (releases cash) |
Accounts Payable | Cash inflow (delays payment) | Cash outflow (pays cash) |
This table highlights how each movement shows up in your operating cash flow statement.
Key Insight: Getting ∆WC right means your cash flow model will mirror real-world liquidity changes.
Automate Calculations For Consistency
Spare yourself manual copy-and-pastes by using Excel named ranges (Microsoft Excel) or Python scripts (Python).
Build dynamic formulas so that inputs update automatically across reporting periods.
Cross-check your outputs against published cash flow statements or management reports.
Monitor Trends And Seasonality
Plot your ∆WC on a rolling twelve-month basis to catch seasonal swings or one-off events early. That’s your dashboard for spotting cash crunches before they bite.
To illustrate:
If accounts receivable climb from $200,000 to $260,000, you record a $60,000 cash outflow.
A $15,000 drop in inventory turns into an equal cash inflow.
A $10,000 rise in accounts payable adds another inflow.
By following these steps every period, you’ll create a repeatable, error-resistant process. Clear labels and consistent terminology make forecasting and valuation far sharper—and far more reliable.
Numerical Examples That Illustrate Change In Working Capital
You won’t truly feel what change in working capital means until you run through real numbers. First, we’ll look at a two-line receivables-payables example. Then we’ll expand into a four-line schedule with inventory and accruals.
Simple Two-Line Scenario
Imagine a company where Accounts Receivable climbs from $50,000 to $70,000, and Accounts Payable drops from $30,000 to $25,000.
That shift translates into a cash outflow from higher receivables and another outflow from lower payables.
Component | Beginning Balance | Ending Balance | Change | Cash Effect |
|---|---|---|---|---|
Accounts Receivable | $50,000 | $70,000 | +$20,000 | Cash Outflow |
Accounts Payable | $30,000 | $25,000 | -$5,000 | Cash Outflow |
Total Change In WC | +$15,000 | Net Outflow |
In plain English, the business tied up an extra $15,000 in its day-to-day operations. For a lean startup, that’s like having a surprise expense hit your cash cushion.
Cash tied up in receivables starves your operations, while lower payables accelerate cash burn.
Full Schedule Illustration
Now let’s layer on Inventory and Accruals for a broader view. Seasonal swings often show up here.
Business Model | Receivables Change | Inventory Change | Payables Change | Accruals Change | Net ∆WC |
|---|---|---|---|---|---|
Seasonal Retailer | +$40,000 | +$80,000 | +$20,000 | +$10,000 | +$90,000 |
Steady-Growth Maker | +$10,000 | +$15,000 | +$12,000 | +$5,000 | +$18,000 |
Notice how the retailer’s cash outlay is five times that of the manufacturer during the same period. Holiday prep can be brutal on your cash balance.
Interpretation Insights
When you put these models side by side, a few patterns jump out:
A high ∆WC means you’ll need more financing from operations.
A falling ∆WC could signal you’re collecting faster or drawing down inventory.
One-off items, like bonus accruals, can trick you into thinking there’s a trend.
• Seasonal swings may demand a short-term credit line.
• Steady cycles let you tighten your cash forecasts.
Strong working capital management frees cash for growth, while poor control can stall progress.
Actionable Steps
Review period-over-period balances for every working capital account.
Use rolling calendars to flag seasonal spikes before they bite.
Build scenarios for inventory builds, collection delays, and extended payables.
Stress-test your model by tweaking one account at a time.
Check out our guide on investment banking case studies for more real-world examples and practice problems Investment Banking Case Studies.
Seasonality Versus Growth Patterns
Seasonal retailers often stock up before peak seasons. Manufacturers tend to keep a steady pace. That means:
Retailers might see ∆WC jump by $200,000 in Q3 for holiday inventory.
Manufacturers average about +$20,000 per quarter with uniform invoicing.
Understanding these patterns helps you lock in revolving credit before cash gets tight.
Try It Yourself
Here’s a mini exercise:
Accounts Receivable rises from $80,000 to $100,000.
Inventory falls from $120,000 to $110,000.
Accounts Payable increases from $45,000 to $60,000.
Accruals decrease from $30,000 to $25,000.
Steps:
Calculate each change (e.g., ∆AR = +$20,000).
Label asset increases as outflows and decreases as inflows.
Sum asset changes and subtract liability changes.
Answer: ∆WC = (+$20,000) + (−$10,000) − (+$15,000) + (−$5,000) = −$10,000.
A negative ∆WC here means a $10,000 cash inflow from working capital that period.
Summary Of Examples
These hands-on examples show exactly how shifts on your balance sheet flow through to cash. By practicing both simple and full schedules, you’ll build the intuition that lets you forecast tweaks and plan for risk. Next, weave these ∆WC figures into your DCF model to see how small cash swings can dramatically alter a valuation. Practice often, and you’ll master how cash moves through every line item.
Impact On Cash Flow And DCF Analysis
When you build a cash flow statement or run a DCF, small shifts in working capital can send valuations soaring or plummeting. Working capital acts like a throttle in your engine. A twist of inventory or receivables by a few days can throttle back billions in value.
Here’s where change in working capital lives inside your cash flow statement:
Net income tackles non-cash items like depreciation.
Change in working capital adds or subtracts shifts from the balance sheet.
The result? Operating cash flow, which feeds into free cash flow.
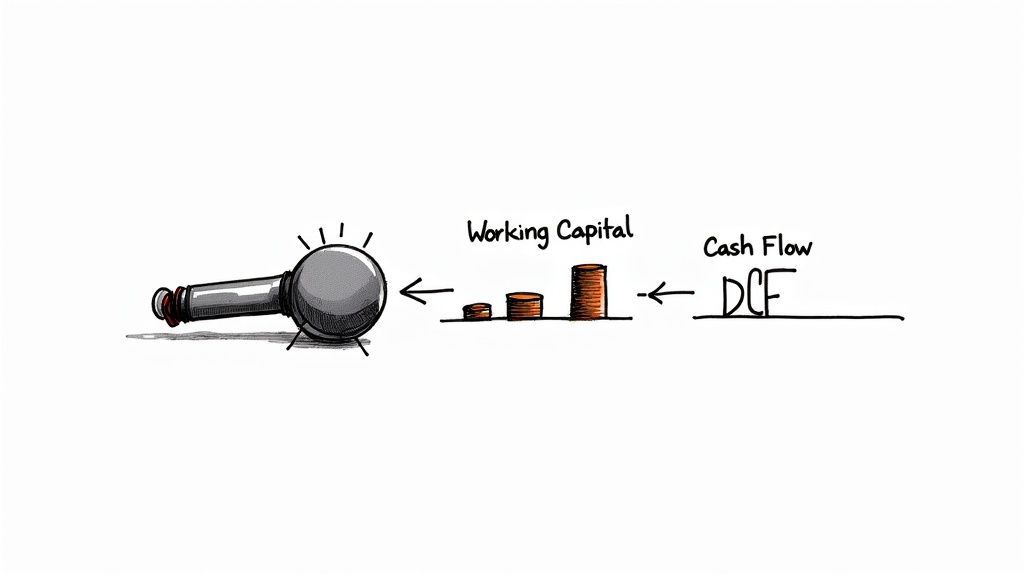
This visual shows how piling up inventory is like flooring the gas with no road beneath it—cash isn’t moving until inventory sells. When receivables tick up, cash flow idles until those invoices clear. On the flip side, rising payables means you hold onto more cash.
Where Change In Working Capital Fits
In the cash flow statement, change in working capital sits under operating activities. It tweaks net income to reflect how receivables, inventory, and payables swing from period to period.
For example, stocking up on parts before a new product launch bulks up inventory and dents that quarter’s cash flow.
Key Insight: Global analyses by PwC covering 17,000 listed companies show that inventory days hit a ten‐year high in cash‐intensive Western sectors, contributing to €300 billion of excess working capital tied up in inventory alone and squeezing corporate liquidity buffers. Read the full research about working capital on PwC
Even a small misstep in forecasting inventory days can skew your DCF by millions. Let’s run a mini case to see it in action.
Mini Case On Inventory Build
Imagine Company X expects 10 % sales growth and plans to add $50 million of inventory to meet that demand. Treat that inventory build as a cash outflow, and you instantly lower next year’s free cash flow by $50 million.
Plug those numbers into a five‐year DCF model—assuming a 10 % discount rate and 5 % terminal growth—and you’ll chop about $70 million off enterprise value.
Scenario | Free Cash Flow Year 1 | Enterprise Value Change |
|---|---|---|
Without Build | $120 million | – |
With Build | $70 million | –$70 million |
A single tweak in working capital can ripple through your valuation like stones skipping across a pond.
Forecasting Tips And Pitfalls
Tie your working capital forecasts to the business’s real drivers. Flat percentages rarely tell the whole story. For example, link inventory days to seasonal sales curves instead of using a static assumption.
Best Practices:
Link to Drivers: Anchor receivables and inventory estimates to revenue or production forecasts.
Validate with Peers: Benchmark days metrics against industry peers to catch outliers early.
Scenario Test: Run stress tests at +/- 10 % changes in working capital to see how sensitive your valuation is.
Avoid rigid growth rates. Your model should breathe with the business cycle. Keep a quarterly journal of working capital days and refresh your assumptions each period.
Check out our guide on investment banking technical questions to sharpen your modeling chops and steer clear of common mistakes.
By weaving change in working capital into your cash flow and DCF, you’ll produce valuations that truly capture liquidity in motion. Next up: practice problems and pitfalls to hone your forecasting and interpretation skills.
Practice Problems And Common Mistakes To Avoid
Putting theory into practice can feel daunting, but these exercises turn the abstract world of change in working capital into hands-on challenges.
You’ll tackle line-item puzzles and scenario drills that echo real-life budgeting, forecasting, and valuation headaches.
Basic Line Item Exercises
Let’s warm up with a straightforward ∆WC puzzle using three line items: receivables, inventory, and payables.
Problem 1
Accounts Receivable: $120,000 → $140,000
Inventory: $90,000 → $85,000
Accounts Payable: $60,000 → $55,000
Follow these steps:
Calculate each ending balance minus the starting balance.
Remember that increases in assets are cash outflows; rises in liabilities are inflows.
Add up the changes to find the net ∆WC.
Key takeaway: Marking inflows and outflows clearly cuts down on sign errors in your cash flow.
Scenario Analysis Questions
Now pretend you’re forecasting for a seasonal retailer ramping up stock for a holiday rush.
Inputs
Sales growth estimate 20%
Inventory days jump 50 to 80 days
Receivables days steady at 45 days
Payables days extended from 30 to 40 days
First, use your days-in-inventory (DIO) formula to figure out the extra cash tied up in stock. Then adjust for DSO and DPO to uncover the net change in working capital.
In this example, seasonality can drive cash needs roughly 30% higher.
Advanced Forecast Scenarios
Problem 3 throws a cyclical manufacturer into the mix, complete with long lead times and quarter-to-quarter swings.
Assume
Receivables days: 60 to 75 days quarterly
Inventory days: 120 to 150 days during expansion
Payables days: 45 to 50 days in lean months
Translate those days into dollar amounts by tying them to annual sales and COGS. Smooth out the wild swings with rolling averages before feeding them into your DCF.
Common mistake: Forgetting to annualize days movements before converting to cash.
Common Pitfalls To Avoid
Even seasoned analysts stumble over these traps:
Mistake | Why It Happens | How To Fix |
|---|---|---|
Mixing cash with non-cash accounts | Rushing data pulls from balance sheet | Exclude cash and short-term debt |
Misclassifying accruals as payables | Overlooking separate accrual accounts | Create distinct line items for accruals |
Overlooking seasonal swings | Using flat working-capital ratios | Model seasonality with period indices |
Ignoring DPO normalization | Annualizing days metrics incorrectly | Normalize days-payable-outstanding |
Attention to line item detail ensures your cash flow model mirrors real liquidity shifts.
Tips For Accurate Modeling
Clearly label each balance-sheet account in your template.
Tie receivables and inventory forecasts to revenue drivers or production schedules.
Benchmark days metrics against peers in the industry.
Chart ∆WC on a rolling twelve-month view to catch unusual spikes.
Automate ∆WC calculations with named ranges in Excel or simple Python scripts. Practice these drills monthly to fine-tune your instincts. Soon, you’ll catch data mismatches and sign errors before they derail your DCF.
Customize problems for different industries:
A service firm has minimal inventory but big accrual swings around bonuses.
A heavy-equipment maker faces massive inventory builds for new product launches.
Try forecasting with both days metrics and direct dollar shifts to see which method jives best with your model audit.
Regular practice and careful reviews will cement your expertise in change in working capital.
Use these exercises as a regular drill to catch errors before they escalate. Over time, this disciplined approach to change in working capital will make your forecasts highly reliable.
Frequently Asked Questions
Below are straightforward answers to the most pressing questions on change in working capital.
Why Exclude Cash And Short-Term Debt
Cash feels like the most liquid asset, but including it muddies the waters. By stripping out cash and short-term borrowings, you zero in on the capital actually tied to daily operations.
Think of it like separating your mortgage payment from your grocery budget—mixing them makes no sense. Excluding these items reveals true movements in receivables, inventory, and payables.
Isolates operational cash flow
Prevents financing activities from skewing working capital
Sharpens visibility into receivables, inventory, and payables
Keep financing noise out so you only track operational shifts.
How To Project Working Capital For Fast-Growing Companies
When growth accelerates, historical ratios can lag behind reality. A rolling average smooths out one-off spikes and uncovers the real trend beneath rapid expansion.
Weight recent quarters more heavily and refresh your forecasts every quarter. It’s like tuning an engine while you’re already at full throttle.
Review the past three years of working capital changes
Stress-test models against aggressive growth scenarios
Adjust for upcoming product launches or new market entries
Key Insight: Blending historical ratios with rolling averages delivers a more accurate picture under hypergrowth.
What If Your Business Is Highly Seasonal
Seasonal swings—think holiday surges or summer slumps—can distort period-end balances. To smooth out those peaks and troughs, apply a seasonality index or use a rolling twelve-month view.
Map your working capital days directly to revenue cycles. It’s like planning fuel stops on a cross-country drive to avoid running dry.
Smooth month-by-month data to surface true trends
Combine rolling averages with seasonal factors
Link inventory forecasts to expected sales peaks
Align your working capital needs with your busiest and slowest seasons.
How To Adjust Your DCF Model When Working Capital Improves
Faster collections or leaner inventory releases cash sooner—your DCF must capture that. Update the working capital line item to reflect lower DSO or DIO.
Then, build out scenario analyses—base, upside, and downside—around those key drivers. This approach keeps surprises out of your valuation.
Update assumptions for improved DSO and DIO
Define base, upside, and downside cases for each metric
Present a sensitivity table highlighting what moves the needle
Scenario testing ensures you see the full range of possible outcomes.
Best Practices For Scenario Testing
Define clear base, upside, and downside cases
Tie your assumptions directly to revenue or COGS drivers
Display a concise sensitivity table for stakeholders
These steps help you avoid costly forecast errors.
Ready to sharpen your finance interview skills? Try AskStanley AI for infinite technical drills and realistic mock interviews.