Financial Modeling: financial modeling best practices for 2025 interviews

In the high-stakes world of investment banking interviews, a generic financial model will not cut it. Recruiters are not just looking for correct answers; they are testing your ability to build robust, scalable, and error-free models under pressure. This is where mastering financial modeling best practices becomes your critical advantage. A well-structured model signals discipline, attention to detail, and a deep understanding of financial mechanics, which are the qualities that separate top-tier candidates from the rest. The ability to produce a clean, auditable, and dynamic model is the baseline expectation for any incoming analyst or associate.
This guide moves beyond basic Excel tips, providing a prioritized roundup of the ten core principles that investment banks expect you to know cold before you even walk through the door. Think of this not as a list of suggestions, but as a mandatory checklist for interview success and on-the-job excellence. We will cover everything from architecting a modular three-statement model to implementing bulletproof error checks and dynamic scenario frameworks. Each practice is designed to be immediately actionable, ensuring your work is both accurate and easily understood by senior bankers.
Throughout this article, you will find specific implementation details, practical examples, and interview-facing insights to help you demonstrate not just competence, but true mastery. We will equip you with the exact techniques needed to build models that are flexible, reliable, and transparent. By internalizing these financial modeling best practices, you will be prepared to turn your next case study or modeling test into a definitive offer, proving you have the technical rigor required to excel from day one. This is your playbook for building models the way a top-tier bank expects.
1. Modular and Layered Model Architecture
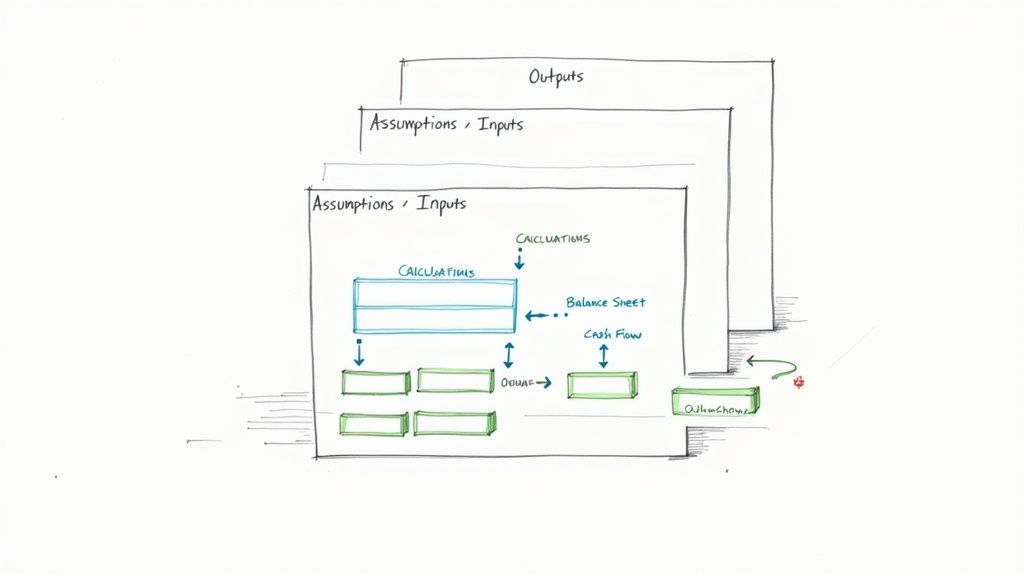
The cornerstone of elite financial modeling best practices is a modular and layered architecture. This design principle mandates the strict separation of a model into distinct, logical sections: Inputs, Calculations, and Outputs. Think of it as building with LEGO blocks instead of a single piece of clay; each component is self-contained yet integrates seamlessly into the whole, making the model transparent, scalable, and far easier to debug.
This structure isolates assumptions (the "what-ifs") from the core logic (the "how") and the final results (the "so what"). When a senior banker asks you to tweak a revenue growth assumption, you can navigate directly to a dedicated inputs sheet without risking an accidental change to a complex formula deep within the calculation engine. This separation is fundamental to building trust in your model’s integrity.
How It Works
A typical layered model organizes worksheets by function. An "Inputs" or "Assumptions" sheet houses all key drivers like growth rates, margins, and multiples. The "Calculations" or "Working" sheets take these inputs and perform the heavy lifting, building schedules for debt, depreciation, and working capital. Finally, "Output" or "Summary" sheets present the clean, client-ready financials, charts, and valuation summaries.
Actionable Implementation Tips
To effectively implement this structure, follow these battle-tested conventions:
Dedicated Input Sheet: Create a single, primary worksheet named "Inputs," "Drivers," or "Assumptions" at the very beginning of your workbook. This should be the only place where a user needs to enter data.
Consistent Color Coding: Adhere to the universal standard: blue font for hard-coded inputs or assumptions, and black font for formulas that link to other cells. This simple visual cue drastically speeds up model auditing.
Logical Sheet Flow: Arrange your worksheets from left to right in a logical sequence that mirrors the model's data flow: Inputs → Historicals → Working Schedules → Core Financial Statements → Valuation → Outputs & Charts. This creates an intuitive user experience.
2. Consistent Naming Conventions and Cell Referencing
A disciplined approach to naming conventions and cell referencing is a hallmark of professional-grade financial modeling best practices. This practice moves beyond cryptic cell addresses like =H42 * (1 + $B$6) and replaces them with self-documenting formulas like =PriorYearRevenue * (1 + g_RevenueGrowth). By assigning descriptive names to cells and ranges, you transform your model from an intimidating grid of numbers into a readable, logical narrative.
This structured approach significantly reduces the cognitive load required to understand and audit complex formulas. When you or a colleague revisit the model months later, the logic remains instantly clear without needing to trace every cell reference back to its source. This clarity is not just a convenience; it is a critical defense against errors and a cornerstone of building robust, maintainable models trusted by management and clients alike.
How It Works
This principle is implemented using Excel’s Name Manager. Instead of referring to a cell like Inputs!C10, you can define that cell with a name, such as WACC_Assumption. Every formula that uses this assumption will then reference the name, not the address. This practice extends to entire worksheets and even constants within VBA code, creating a consistent and logical language throughout the entire workbook.
Actionable Implementation Tips
To effectively implement this structure, follow these battle-tested conventions:
Use Descriptive Prefixes: Standardize names to indicate their function or data type. For example, use
inp_for inputs (e.g.,inp_TaxRate),calc_for major calculations, andflag_for switches or checks. This convention provides immediate context within any formula.Establish a Naming Glossary: Create a dedicated worksheet or a section in your documentation that lists all named ranges and their definitions. This "data dictionary" is invaluable for auditing and onboarding new users to the model.
Leverage Name Manager: Systematically use Excel’s Name Manager (found under the Formulas tab) to create, edit, and audit all named ranges. This tool provides a central command center for ensuring all names are applied correctly and consistently.
Avoid Spaces and Special Characters: When creating names, use underscores (
_) or camel case (camelCase) instead of spaces, which are not permitted. Keep names concise but descriptive to maintain formula readability.
3. Sensitivity and Scenario Analysis Framework
A static model provides a single answer, but the real world is dynamic and uncertain. Building a robust sensitivity and scenario analysis framework is a critical financial modeling best practice that transforms a model from a simple calculator into a strategic decision-making tool. This framework systematically tests how financial outcomes, like IRR or equity value, react to changes in key underlying assumptions, revealing which drivers have the most significant impact.
This practice is non-negotiable in high-stakes environments like M&A or capital budgeting. It allows analysts to quantify risk and present a range of potential outcomes rather than a single, misleadingly precise number. When a managing director asks, "What happens to our return if an economic downturn cuts growth by 2% and compresses margins by 100 bps?" a well-built model can provide the answer in seconds, demonstrating foresight and analytical rigor.
How It Works
This framework operates on two levels. Scenario analysis involves creating distinct, plausible narratives for the future, such as a "Base Case," an optimistic "Bull Case," and a pessimistic "Bear Case." Each case adjusts a bundle of key assumptions simultaneously. Sensitivity analysis, often presented in data tables, isolates one or two key variables (like revenue growth or exit multiple) and flexes them across a range of values to see the isolated impact on a specific output.
Actionable Implementation Tips
To build a professional-grade analysis framework, integrate these techniques:
Isolate Key Drivers: Identify the 5-7 most impactful assumptions (e.g., price, volume, WACC, terminal growth rate). Overloading a sensitivity analysis with too many variables dilutes its clarity and becomes unmanageable.
Build a Dedicated Analysis Sheet: Create a separate worksheet named "Sensitivity" or "Scenarios." This sheet should pull in the key outputs from your model and contain all your data tables and scenario toggles, keeping your core calculations clean.
Use Scenario Switches: Implement a simple drop-down menu or a CHOOSE function on your "Inputs" sheet to toggle between different scenarios (Base, Bull, Bear). This allows the entire model to recalculate instantly based on the selected case.
Leverage Data Tables: Master Excel's one-variable and two-variable Data Table feature (
Alt + A + W + T). This is the standard tool for creating sensitivity tables that show, for instance, how valuation changes across a matrix of different growth rates and EBITDA margins.
4. Balance Sheet Articulation and Circularity Management
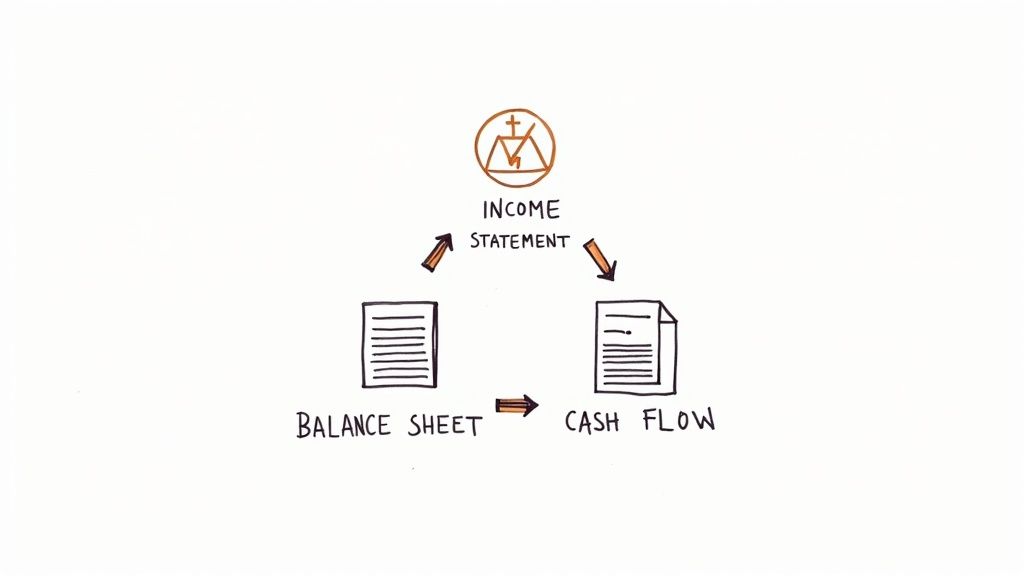
A non-negotiable tenet of financial modeling best practices is achieving perfect articulation between the three core financial statements. This means ensuring the Income Statement, Balance Sheet, and Cash Flow Statement are dynamically and mathematically linked, where a change in one flows logically through the others. The model is only credible if it balances; specifically, if Assets always equal Liabilities + Equity.
This dynamic linkage often creates a circularity problem, where an output (like net interest expense) is required as an input (to calculate net income). Managing this is a hallmark of a skilled analyst. For instance, in an LBO model, interest expense on the income statement depends on the debt balance, but the debt balance on the balance sheet depends on the cash flow available to pay it down, which is determined by net income. This interdependence requires careful management to avoid breaking the model.
How It Works
Proper articulation ensures the model accurately reflects a company's financial reality. The process begins with net income from the Income Statement, which flows to the top of the Cash Flow Statement and into Retained Earnings on the Balance Sheet. The Cash Flow Statement then reconciles this net income to the actual change in cash, with the ending cash balance flowing back to the Balance Sheet. If every link is built correctly, the Balance Sheet will balance, proving the model's integrity. For a deeper dive, you can learn more about how the three financial statements interconnect.
Actionable Implementation Tips
To master financial statement linkage and manage circularity, integrate these techniques:
Implement a Balance Check: Add a dedicated row at the bottom of the Balance Sheet labeled "Balance Check" or "Error Check." The formula should be
Assets - (Liabilities + Equity). This check must equal zero for all periods.Use Iterative Calculations Cautiously: Enable iterative calculations in Excel (File > Options > Formulas) to solve for circularities automatically. However, use this as a last resort, as it can hide formula errors and slow down the workbook. A manual "circularity switch" or toggle is often a more robust solution.
Build Schedules Separately: Isolate complex drivers like debt and interest in their own dedicated working schedules. A "Debt Schedule" calculates beginning and ending balances, interest, and repayments, keeping the core statements clean and making the source of the circularity easy to trace.
5. Formula Auditing and Error-Checking Protocols
A model is only as reliable as its formulas. Implementing rigorous formula auditing and error-checking protocols is not just a best practice; it's a non-negotiable requirement for building a trustworthy financial model. This systematic process involves proactively identifying and eliminating errors, from simple broken links to complex circular references, ensuring the model's outputs are mathematically sound and defensible under scrutiny.
This discipline separates amateur modelers from professionals. A single misplaced parenthesis or incorrect cell reference can cascade into a valuation error worth millions, jeopardizing a deal or a strategic decision. By building in checks and balances from the start, you create a resilient model that can withstand intense review from senior bankers and clients alike, a crucial skill often tested during investment banking technical questions.
How It Works
This practice involves a multi-layered defense against errors. It starts with leveraging Excel’s built-in tools like Trace Precedents/Dependents to visually map formula logic and hunt down circular references. It extends to creating dedicated "check" or "validation" worksheets that contain formulas designed solely to test the integrity of the model, such as ensuring the balance sheet always balances (Assets = Liabilities + Equity).
Actionable Implementation Tips
To embed robust error-checking into your workflow, integrate these key habits:
Create a Dedicated Checks Sheet: Build a separate worksheet named "Checks" or "Validation." Populate it with simple formulas that test core accounting principles (e.g.,
Balance Sheet Assets - (Liabilities + Equity)). This cell should always equal zero; use conditional formatting to make it flash red if it doesn't.Leverage Excel Auditing Tools: Regularly use
Ctrl+[(Trace Precedents) andCtrl+](Trace Dependents) to understand formula relationships. Master the `Ctrl+`` (Show Formulas) view to quickly scan for inconsistencies in formula patterns across a row or column.Test with Extreme Values: Stress-test your formulas by inputting extreme assumptions (e.g., 0% or 1000% growth). This can quickly reveal formulas that break down or produce illogical results under unconventional scenarios.
Implement a "Peer Review" Sign-Off: Before a model is finalized, have a colleague review it. A fresh set of eyes is one of the most effective tools for catching errors you’ve become blind to. This mirrors the quality control protocols used by Big 4 accounting firms.
6. Flexible and Scalable Assumptions Management
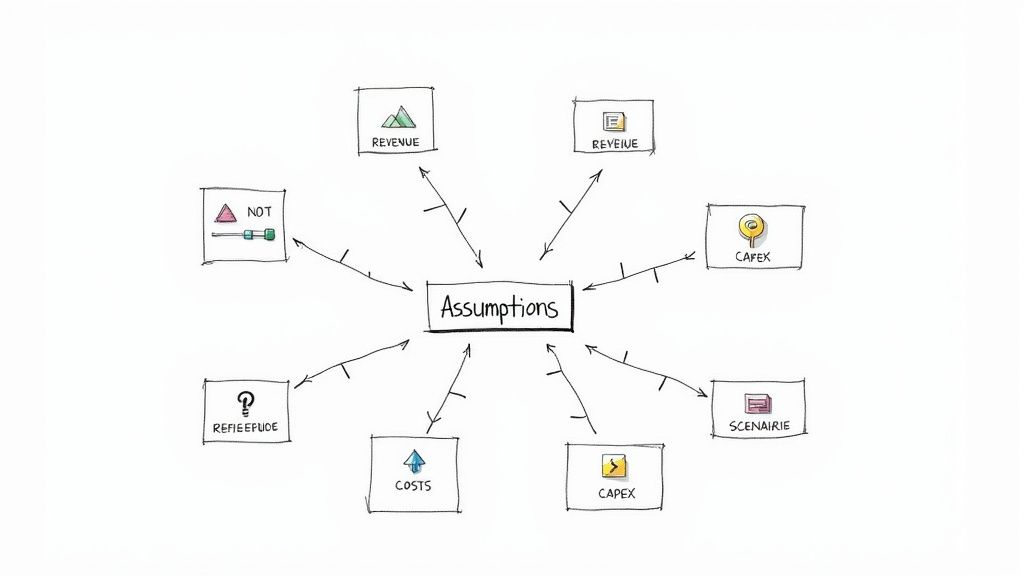
A superior financial model is not static; it's a dynamic tool for decision-making. This requires a flexible and scalable assumptions framework, a core tenet of advanced financial modeling best practices. This principle moves beyond simply isolating inputs; it involves building a centralized, dynamic control panel for every key driver, allowing for instant modification and scenario testing without ever hardcoding a value within the calculation engine.
This approach treats assumptions not as fixed numbers but as variables that can be toggled, ramped, or switched. When a managing director wants to see the impact of a more aggressive pricing strategy or a delayed product launch, a flexible assumption framework lets you provide the answer in minutes, not hours. This agility is what separates a basic model from an indispensable analytical tool.
How It Works
This practice is implemented by creating a master "Assumptions" or "Scenarios" sheet that acts as the model's command center. Instead of just listing inputs, this sheet organizes them by business unit, geography, or driver type (e.g., Revenue, COGS, OpEx). It often includes multiple columns for different scenarios like "Base Case," "Upside Case," and "Downside Case," with a single cell selector that dictates which set of assumptions flows through the entire model using INDEX/MATCH or CHOOSE functions.
Actionable Implementation Tips
To build a truly dynamic assumptions framework, incorporate these techniques:
Create a Master Assumptions Sheet: Centralize all key drivers on a single worksheet. Group them logically (e.g., Revenue Assumptions, Cost Assumptions, CapEx Assumptions) for clarity and ease of navigation.
Use Data Validation for Control: For categorical inputs like product tiers or growth phases, use drop-down lists (Data > Data Validation). This prevents input errors and makes the model more user-friendly.
Build a Scenario Selector: Implement a single drop-down cell (e.g., select 1 for Base, 2 for Upside) on the assumptions sheet. Link all active assumptions to this selector, allowing one-click changes to the entire model’s operating case.
Include an Assumption Change Log: Add a simple text box or a dedicated section on the assumptions sheet to document any changes made, noting the date, the person who made the change, and the rationale. This is crucial for maintaining model integrity and auditability.
7. Documentation and Model Specification Sheets
A model without documentation is a black box, inspiring little confidence and creating significant key-person risk. One of the most critical financial modeling best practices is creating comprehensive documentation that serves as a user manual, an audit trail, and a record of your thought process. It transforms a complex spreadsheet from a personal tool into a durable, institutional asset.
This practice involves creating a dedicated sheet or an accompanying document that clearly explains the model's purpose, structure, key assumptions, and limitations. For complex models used in regulatory submissions or M&A deals, this isn't just a best practice; it's a requirement. Proper documentation ensures the model can be understood, used, and updated by others long after you've moved on, ensuring continuity and trust in its outputs.
How It Works
Effective documentation is typically housed on a dedicated "Cover," "Index," or "Specs" sheet at the very front of the workbook. This sheet acts as a central hub, providing a high-level overview and guide. It should name the model owner, list the last updated date, and detail the version history. More importantly, it should explain the model's objective, outline the flow of information between sheets, and justify the core methodologies used.
For instance, a real estate development model's spec sheet would detail the sources for its construction cost estimates, justify the chosen lease-up timeline with market data, and explicitly state its limitations, such as not accounting for environmental remediation risks.
Actionable Implementation Tips
To build institutional-grade models, embed documentation directly into your workflow:
Create a Standard Spec Sheet: Develop a template covering key areas: Model Purpose, Version Control, User Instructions, Key Assumptions & Sources, and Limitations. Use this as the first sheet in every new model.
Maintain a Detailed Change Log: On your specification sheet, include a table that logs every material change. Record the date, version number, the person who made the change, and a brief description of the update.
Justify Key Assumptions: Don't just list an assumption; justify it. Next to a driver like "5.0% Revenue Growth," add a comment or a cell note citing the source, for example, "Source: Management guidance from Q3 earnings call."
Include a 'Checks' Summary: A great documentation practice is to summarize all error checks on the cover page with a simple "OK" or "ERROR" status. This gives users immediate confidence that the model is functioning correctly.
8. Scenario and Waterfall Analysis for Decision Support
A static model provides a single view of the future, but the real world is dynamic and uncertain. Elite financial modeling best practices involve building robust frameworks for scenario and waterfall analysis to provide clear, compelling decision support. This approach moves beyond a single "base case" to illustrate how key variables impact outcomes, effectively telling the story behind the numbers.
This methodology is crucial for communicating with senior stakeholders, such as executives and boards, who need to understand the "why" behind changes in value. A waterfall chart visually deconstructs the cumulative effect of sequentially introduced positive and negative factors, bridging the gap between a starting and ending value. Paired with discrete scenarios (e.g., Bear, Base, Bull), it creates a powerful narrative for strategic planning and risk assessment.
How It Works
Scenario analysis involves creating distinct sets of assumptions that drive different model outputs. For instance, a "Bull Case" might assume higher revenue growth and margin expansion, while a "Bear Case" assumes the opposite. A waterfall chart then visualizes the drivers of change between these scenarios or over a period. For example, it can break down the change in EBITDA from one year to the next into components like volume growth, price increases, and cost-saving initiatives.
Actionable Implementation Tips
To build impactful scenario and waterfall analyses, apply these proven techniques:
Use a Scenario Switch: Implement a single input cell (a "switch" or dropdown menu using data validation) that controls which set of assumptions (Bear, Base, Bull) flows through the entire model. This allows for instantaneous toggling between outcomes.
Limit Waterfall Drivers: Keep waterfall charts clean and impactful by focusing on the 5-7 most significant drivers. Too many components dilute the message and make the chart difficult to read.
Maintain Color Discipline: Use a consistent and intuitive color scheme. The standard is green for positive impacts (e.g., revenue growth, synergy realization) and red for negative impacts (e.g., increased costs, market share loss).
Present Scenarios Side-by-Side: Create a summary output sheet that presents key metrics like Revenue, EBITDA, EPS, and IRR across all scenarios in a single table. This facilitates quick comparison and is a common feature in investment banking case studies. Explore comprehensive examples to master this technique in our guide to investment banking case studies.
9. Version Control and Change Management System
One of the most overlooked yet critical financial modeling best practices is implementing a rigorous version control and change management system. Without it, a model becomes a "black box" where changes are untraceable, errors multiply, and collaboration devolves into chaos. A disciplined system ensures that every modification is deliberate, documented, and recoverable, which is non-negotiable in high-stakes environments like M&A transactions or regulatory reporting.
This practice transforms a model from a static file into a living document with a clear history. When a Managing Director questions a change made three weeks ago, you can pinpoint the exact version, the author, the date, and the reason for the adjustment. This level of transparency and accountability is essential for maintaining model integrity, especially when multiple analysts are working on the same file, and is a hallmark of professional-grade analysis.
How It Works
A version control system is a set of procedures for managing changes to a model over time. At its simplest, it involves a systematic file naming convention and a log of all modifications. More advanced systems might use cloud-based platforms with built-in version history or dedicated software. The goal is to create a complete audit trail, prevent accidental overwrites, and ensure everyone is working from the "single source of truth," the latest approved version of the model.
Actionable Implementation Tips
To build a robust version control process, integrate these professional standards into your workflow:
Standardized Naming Convention: Enforce a strict file naming protocol like ProjectName_ModelType_v1.0_YYYYMMDD_Initials. This immediately communicates the file's purpose, version, date, and last editor.
Maintain a Change Log: Create a dedicated worksheet within the model or a separate file to document every significant change. Log the version number, date, author, a description of the change, and the reason for it.
Archive Old Versions: Never overwrite a previous version. Instead, move outdated files to a designated "Archive" folder. This guarantees you can always roll back to a prior state if a major error is discovered.
Utilize Cloud-Based Platforms: For team-based projects, leverage platforms like SharePoint or Google Sheets. Their built-in version history automatically tracks changes, identifies who made them, and allows for easy restoration of previous versions, greatly simplifying change management.
10. Dynamic Forecasting and Trend Analysis Framework
A truly robust financial model moves beyond simple, straight-line projections. The best practice is to build a dynamic forecasting framework that grounds future assumptions in historical reality while incorporating forward-looking strategic judgments. This involves a rigorous analysis of past performance to identify underlying trends, seasonality, and key business drivers, which then serve as the logical foundation for projecting future results.
This approach prevents the common pitfall of "plugging" arbitrary growth rates. Instead of guessing a revenue growth number, you derive it from a defensible analysis of historical Compound Annual Growth Rate (CAGR), market penetration S-curves, or econometric factors. This data-driven methodology is central to building credible, sophisticated financial models that can withstand intense scrutiny from senior bankers and clients.
How It Works
This framework starts with a deep dive into at least three to five years of historical financial data. You "clean" this data by adjusting for any one-time or non-recurring items to reveal the true operational trends. From there, you can apply various analytical techniques, such as calculating historical averages, CAGRs, or even running simple regressions to project key line items like revenue, costs, and margins. The goal is to balance this quantitative analysis with qualitative insights from industry research and management expectations.
Actionable Implementation Tips
To build a powerful forecasting engine, integrate these financial modeling best practices:
Establish a Clear Base: Dedicate a section of your model to cleaning and normalizing historical financials. Clearly label and document all adjustments made for one-off events (e.g., asset sales, litigation costs) so the "true" historical trend is evident.
Segment Your Forecasts: Avoid a single, monolithic growth rate. Break down revenue and costs by business unit, product line, or geography. This allows for more granular and accurate projections, such as modeling high growth for a new product and mature growth for a legacy one.
Implement a Two-Stage Model: Structure your forecast into an explicit forecast period (typically 5-10 years) with detailed, driver-based projections, and a terminal period where growth normalizes to a sustainable, long-term rate (e.g., GDP growth or inflation).
Justify Every Assumption: For every projection, document the "why" behind it. Link your forecast drivers back to historical trends, industry benchmarks, or specific strategic initiatives. For example, forecast margin expansion by tying it to a new operational efficiency program.
10-Point Financial Modeling Best Practices Comparison
Item | Implementation Complexity 🔄 | Resource Requirements ⚡ | Expected Outcomes 📊 ⭐ | Ideal Use Cases | Key Advantages 💡 |
|---|---|---|---|---|---|
Modular and Layered Model Architecture | High 🔄🔄🔄🔄 — upfront design & structure | Moderate — planning time; reusable once built ⚡⚡ | Strong auditability, maintainability; clarity ⭐⭐⭐⭐ 📊 | DCFs, PE transaction models, corporate forecasting | Reduces errors; enables collaboration; simplifies updates |
Consistent Naming Conventions and Cell Referencing | Low–Medium 🔄🔄 — discipline & setup | Low — initial naming effort; minimal tooling ⚡⚡⚡ | Clearer formulas, fewer reference errors; faster audits ⭐⭐⭐⭐ 📊 | Standardized templates, FP&A, large workbooks | Improves readability; speeds maintenance; aids team handover |
Sensitivity and Scenario Analysis Framework | Medium–High 🔄🔄🔄🔄 — framework + potential simulations | Medium–High — compute/time for tables or Monte Carlo; optional tools ⚡⚡ | Quantifies drivers and downside/upside; risk insights ⭐⭐⭐⭐ 📊 | VC valuations, bank stress tests, R&D project appraisal | Identifies key drivers; supports stress-testing and decisions |
Balance Sheet Articulation and Circularity Management | High 🔄🔄🔄🔄🔄 — accounting detail & circular refs | High — accounting expertise; may slow calculations ⚡⚡ | Fully reconciled statements; higher credibility ⭐⭐⭐⭐📊 | LBOs, acquisitions, bank forecasts, project finance | Catches inconsistencies; enables covenant and debt analysis |
Formula Auditing and Error-Checking Protocols | Medium 🔄🔄🔄 — processes and peer review | Moderate — time for checks, versioning and governance ⚡⚡ | Fewer costly errors; improved trustworthiness ⭐⭐⭐⭐⭐ 📊 | Regulated models, risk models, audit-heavy environments | Prevents mistakes; documents logic; supports compliance |
Flexible and Scalable Assumptions Management | Medium–High 🔄🔄🔄🔄 — centralization & dynamic links | Moderate — design effort; possible UI (selectors) ⚡⚡⚡ | Rapid scenario testing; transparent inputs; traceability ⭐⭐⭐⭐ 📊 | Corporate planning, pharma NPV, telecom projections | Centralizes inputs; safer edits; speeds scenario swaps |
Documentation and Model Specification Sheets | Medium 🔄🔄🔄 — extensive writing and diagrams | Moderate–High — time and stakeholder input; low tooling ⚡⚡ | Regulatory readiness, knowledge transfer; lower misuse ⭐⭐⭐⭐ 📊 | SEC filings, bank stress tests, pharma regulatory models | Ensures compliance; preserves institutional knowledge |
Scenario and Waterfall Analysis for Decision Support | Low–Medium 🔄🔄 — prepare visuals and assumptions | Low — visualization tools and summary data ⚡⚡⚡ | Clear communication of drivers; stakeholder buy-in ⭐⭐⭐⭐ 📊 | Earnings presentations, PE/LP updates, budget variance reports | Simplifies complex moves; highlights contributor impact |
Version Control and Change Management System | Medium 🔄🔄🔄 — processes + tool integration | Moderate — governance overhead; backups and controls ⚡⚡ | Audit trail, recovery, accountability; safer collaboration ⭐⭐⭐⭐ 📊 | Multi-user models, enterprise repositories, regulatory models | Prevents loss; documents changes; enables rollback |
Dynamic Forecasting and Trend Analysis Framework | Medium–High 🔄🔄🔄🔄 — statistical methods and validation | High — quality historical data, statistical tools/expertise ⚡⚡ | Data-driven projections; detects trends & inflection points ⭐⭐⭐⭐ 📊 | Revenue forecasts, SaaS LTV, commodity price models | Reduces subjective bias; supports defensible forecasts |
Putting Theory into Practice: Your Next Steps to Modeling Excellence
We have journeyed through the core tenets of elite financial modeling, from establishing a modular and layered architecture to implementing robust error-checking protocols and dynamic forecasting frameworks. Each of the ten principles we've discussed is a critical component in the machinery of a high-functioning financial model. However, understanding these concepts individually is only the first step. The true mark of an exceptional analyst, and a top-tier investment banking candidate, is the ability to weave these practices together into a seamless, instinctual workflow.
Merely memorizing the rules for consistent naming conventions or the steps to build a scenario manager is insufficient. True mastery is achieved when these financial modeling best practices become second nature, allowing you to focus on the strategic insights the model reveals rather than getting bogged down in its mechanics. It's about building a model that not only yields the correct answer but is also transparent, flexible, and easily auditable-especially under the intense scrutiny of a managing director or during a high-stakes interview case study. The difference between a candidate who gets a "maybe" and one who secures the offer often comes down to this demonstrable fluency.
From Knowledge to Muscle Memory: Your Action Plan
To bridge the gap between theoretical knowledge and practical application, you must actively and intentionally practice. The goal is to internalize these habits so they become your default operating procedure. Here is a structured approach to get you there:
Deconstruct and Rebuild: Take a completed M&A or LBO model template. Instead of just reviewing it, delete the core calculation blocks and rebuild them from scratch, applying the principles of modular design and flexible assumption management. This exercise forces you to engage with the logic, not just the output.
The "Peer Review" Challenge: Swap a model you’ve built with a classmate or peer. Your task is to audit their model for adherence to the best practices outlined in this guide. Can you easily follow their formula logic? Is the documentation clear? This simulates the real-world experience of inheriting a model and trains your eye for quality.
Timed Modeling Drills: The investment banking interview process is a pressure cooker. Set a timer for 60 or 90 minutes and build a simple three-statement model from a blank Excel sheet. This will quickly reveal which areas, from keyboard shortcuts to balance sheet articulation, need more refinement.
Why This Diligence Matters
Investing the time to internalize these financial modeling best practices yields dividends far beyond passing an interview. In your future role as an analyst or associate, you won't be building models in a vacuum. Your work will be reviewed, stress-tested, and relied upon to guide multi-million or billion-dollar decisions.
A clean, well-structured, and dynamic model is more than just a calculation tool; it is a communication device. It conveys your attention to detail, your logical thinking, and your credibility as a financial professional. A sloppy model erodes trust, while a pristine one builds it.
Ultimately, the habits you form now will define the quality of your work and your reputation on the desk. By treating every model you build as a professional product, you are preparing not just for the next interview, but for a successful career in a highly demanding and competitive field. You are building the foundation of discipline, precision, and reliability that separates the good from the great.
Ready to test your skills in a realistic interview setting? AskStanley AI provides an interactive platform where you can run unlimited mock interviews and technical drills, including live financial modeling case studies. Get instant feedback on your application of these financial modeling best practices and build the confidence you need to ace your superday. AskStanley AI is your 24/7 personal interview coach.