How to Calculate FCFF A Practical Guide for Financial Analysts

When you're trying to figure out what a business is truly worth, you have to get to the core of its cash-generating power. That's where Free Cash Flow to the Firm (FCFF) comes in.
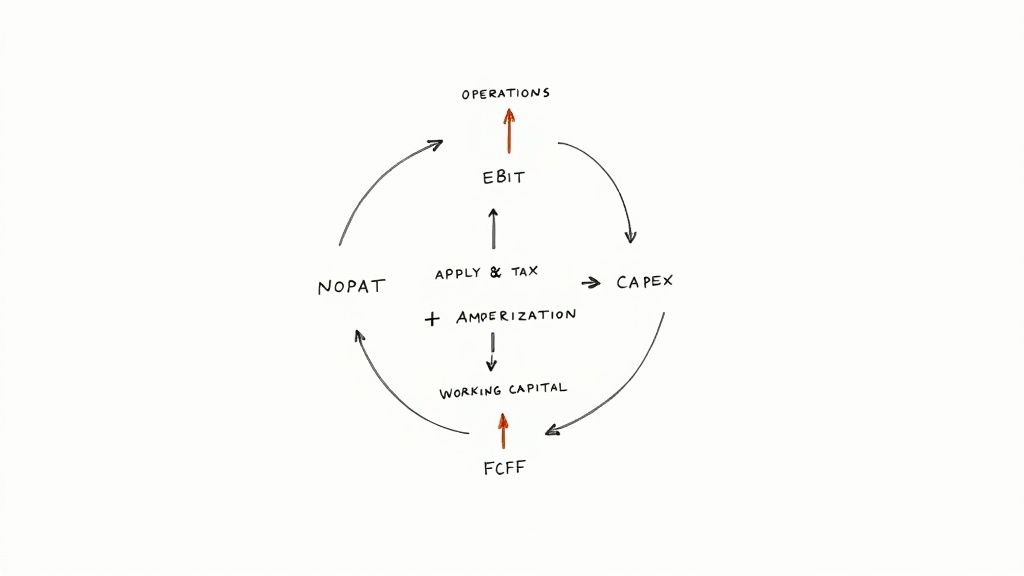
The most common way to calculate it starts with a company's operating profit, or EBIT. You then tax-adjust it, add back the big non-cash charges like depreciation, and subtract what the company reinvested into itself through capital expenditures and working capital.
Think of it this way: EBIT(1-Tax Rate) + D&A - CapEx - ΔNWC. This formula strips away all the noise and gives you the pure, unlevered cash flow available to everyone who has a claim on the company—both equity and debt holders.
Why FCFF Is a Big Deal in Valuation
Before we get lost in the formulas, let’s quickly cover why FCFF is such a critical metric in finance. At its heart, FCFF shows you the total cash a company’s core operations generate before any debt payments are made. It’s the unfiltered truth about how much cash the business itself is spitting out.
This "capital structure neutral" perspective is what makes FCFF so powerful. Unlike net income, which can be twisted by accounting rules and financing choices, FCFF gives you an objective look at a company's operational health. It answers one simple but vital question: How much cash did the business actually produce this period?
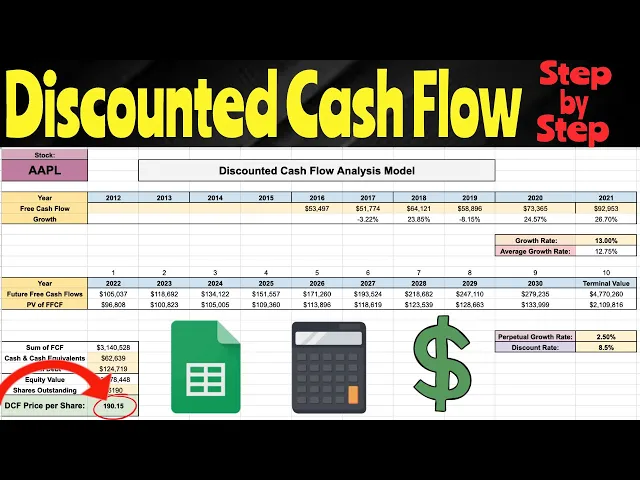
FCFF is the bedrock of any Discounted Cash Flow (DCF) valuation. You project a company's FCFF into the future, discount it back to today using the Weighted Average Cost of Capital (WACC), and that gives you the company's total Enterprise Value.
Mapping the Formula to the Financial Statements
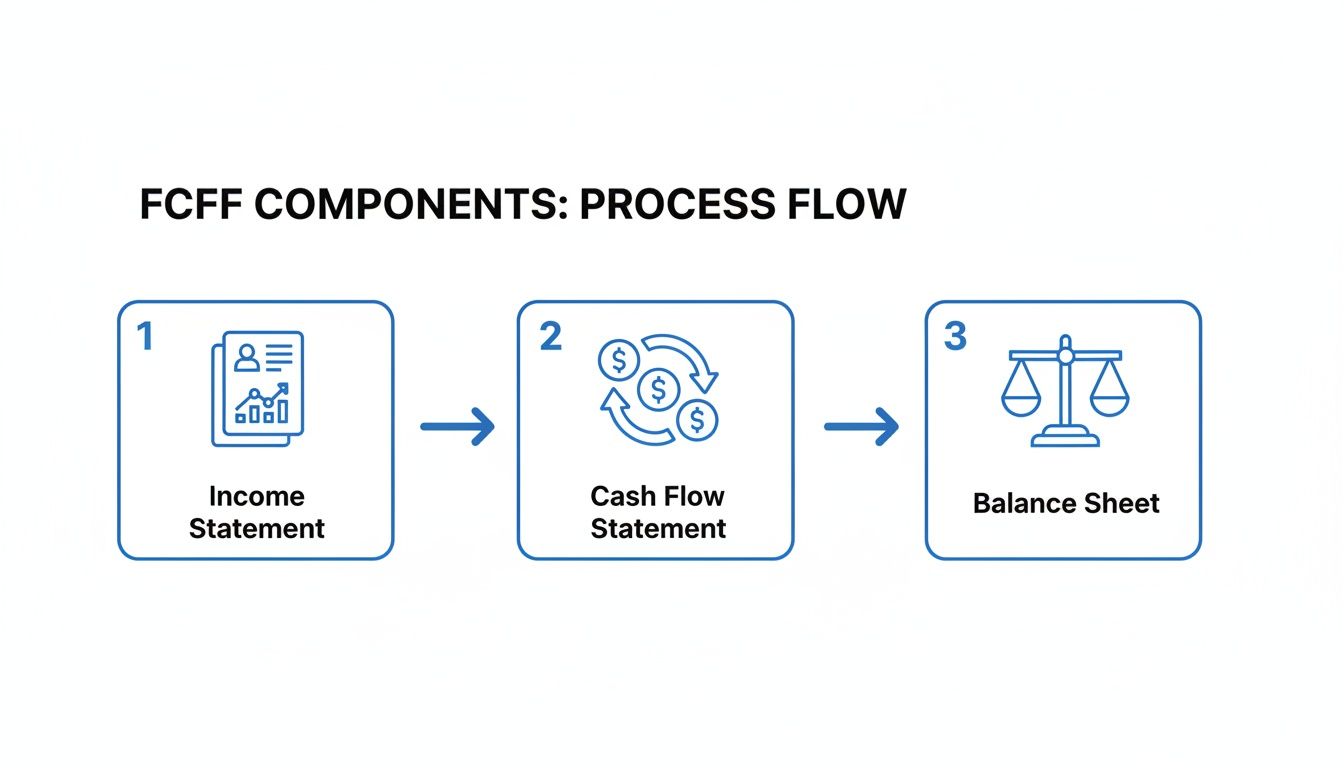
For any analyst, especially when you're in a high-pressure situation like the ones in our investment banking case studies, knowing exactly where to pull these numbers from is non-negotiable. Grab one number from the wrong place, and your entire valuation model goes sideways. It’s an exercise that forces you to connect the dots between all three financial statements.
To get you started, here’s a quick-reference table that breaks down the main FCFF formula. It shows you what each piece means and, more importantly, where to find it.
FCFF Formula Components and Their Sources
Component | Description | Financial Statement Source |
|---|---|---|
EBIT | Earnings Before Interest & Taxes, a measure of core profitability. | Income Statement |
Tax Rate | The company's effective tax rate (Tax Expense / Pre-Tax Income). | Income Statement |
D&A | Depreciation & Amortization, a major non-cash expense. | Cash Flow Statement (or sometimes the Income Statement) |
CapEx | Capital Expenditures, the cash spent on Property, Plant & Equipment. | Cash Flow Statement (Investing Activities section) |
ΔNWC | Change in Net Working Capital (Current Assets - Current Liabilities). | Balance Sheet (by comparing two separate periods) |
Getting comfortable with this mapping is the first real step. Once you can navigate the statements and pull these five items without thinking, you're well on your way to building a solid valuation.
Calculating FCFF Starting From Net Income
While starting with EBIT is a classic, top-down approach, you can also calculate FCFF by working from the bottom of the income statement. This "bottom-up" method, starting with Net Income, is just as valid and, in some ways, more intuitive. It’s like being a detective, starting with the final reported profit and working backwards to see where the cash really went.
Think about it: Net Income is the company's official "profit" after everyone—the government (taxes) and lenders (interest)—has been paid. But it’s an accounting figure, not a cash figure. Our goal is to strip out all the non-cash noise and financing decisions to find the pure, unlevered cash flow generated by the business.
This is where a solid grasp of how the three financial statements connect becomes non-negotiable. You’re pulling pieces from every statement to build the full picture.
The Logic of the Adjustments
To get from Net Income to FCFF, you have to undo the accounting conventions that obscure true cash flow. You're adding back items that were subtracted but didn't cost cash, and accounting for cash outlays that weren't fully expensed on the income statement.
Here’s the formula we’ll be working with:
FCFF = Net Income + Non-Cash Charges (NCC) + [Interest Expense × (1 − Tax Rate)] − Capital Expenditures (CapEx) − Change in Net Working Capital (ΔNWC)
Let’s break down each piece of the puzzle:
Add back Non-Cash Charges (NCC): The big one here is Depreciation & Amortization (D&A). It's an expense on the income statement that lowers your taxable income, but no cash actually leaves the building. We have to add it back.
Add back After-Tax Interest Expense: Net Income is what’s left for equity holders, which means interest paid to debt holders has already been subtracted. FCFF is for all capital providers, so we need to add that interest back. We use the after-tax amount because interest payments are tax-deductible, creating a "tax shield."
Subtract Capital Expenditures (CapEx): This is the cash the company spent on long-term assets like factories, equipment, or technology. It’s a major cash drain required to maintain and grow the business, and it’s not fully captured on the income statement (only the depreciation is). You’ll find this on the cash flow statement.
Subtract Change in Net Working Capital (ΔNWC): This adjustment captures the cash tied up in the company’s day-to-day operations. If accounts receivable or inventory goes up, that’s cash the company has used but can't deploy elsewhere. An increase in NWC is a use of cash, so we subtract it.
The whole process requires you to pull data from everywhere, as this flow diagram shows. You can’t live on the income statement alone.
This really drives home the point that FCFF isn't just a formula—it's a synthesis of a company's entire financial reporting.
A Practical Walkthrough
Let’s put this into practice. A company's financials from a 2023 analysis showed a Net Income of $368 million. By applying our formula and making the necessary adjustments for NCC, after-tax interest, CapEx, and working capital, the calculation yielded an FCFF of $561.4 million.
That’s a big difference, right? The company’s actual cash generation was significantly higher than its reported profit. This particular FCFF figure represented about 15% of the company's $3.7 billion in revenue, a strong indicator of its cash-generating efficiency.
There’s a reason this stuff matters. After the 2008 financial crisis, investors became obsessed with cash flow, realizing that accounting earnings could be misleading. By 2015, a CFA Institute survey found that 78% of analysts were using FCFF as a primary input for their DCF models on S&P 500 companies. It’s the gold standard for a reason.
The Net Income method is powerful because it provides a direct reconciliation from the most commonly cited performance metric—net income—to the company's core cash flow. This creates an easy-to-follow audit trail, making it a favorite for presentations and reports.
The Operations-Focused Approach Using EBIT or NOPAT
While you can definitely get to FCFF by starting with Net Income, many pros—especially in valuation—prefer a more direct, top-down route starting with EBIT (Earnings Before Interest and Taxes). This is pretty much the gold standard for any serious Discounted Cash Flow (DCF) model.
Why? Because it gives you a much cleaner look at the company’s core business performance.
Think of EBIT as the raw earning power of a company’s operations, totally separate from how it decided to finance those operations (i.e., debt vs. equity). By starting here, you isolate the cash-generating engine of the business itself, which is exactly what we need for a solid valuation.
This method gets you to a pure, unlevered cash flow (FCFF), which is the perfect match for the Weighted Average Cost of Capital (WACC) you'll use to discount it.
Understanding NOPAT and the Core Formula
To turn EBIT into a useful cash flow metric, the first thing we have to do is account for taxes. We do this by calculating Net Operating Profit After Tax (NOPAT).
NOPAT is a hypothetical number that answers a simple question: "How much cash profit would this business have generated if it had zero debt?"
The formula is super straightforward: NOPAT = EBIT × (1 – Tax Rate)
Once you have NOPAT, the rest of the calculation is just about adjusting for non-cash expenses and the money the company plows back into the business to keep it running and growing.
Here's the full formula: FCFF = NOPAT + Depreciation & Amortization (D&A) − Capital Expenditures (CapEx) − Change in Net Working Capital (ΔNWC)
Let's break that down:
Add back D&A: Just like before, we add back this big non-cash charge.
Subtract CapEx: We deduct the actual cash spent on PP&E to maintain and expand the asset base.
Subtract ΔNWC: We take out the cash invested in short-term operational assets like inventory.
This approach is a huge favorite in M&A and private equity. In fact, the NOPAT method was used in 65% of private equity deals from 2010-2020, especially for private companies where financial disclosures are a bit thinner. Siemens AG’s 2022 calculation of €5.6 billion in FCFF, for example, was built on this exact logic. It gave a clear picture of its operational cash generation, even with all the global supply chain headaches. For a deeper dive, check out these FCFF calculation insights.
A Quick Numerical Example
Let's put some numbers to this. Say a company reports the following:
EBIT: $500 million
Effective Tax Rate: 25%
Depreciation & Amortization (D&A): $100 million
Capital Expenditures (CapEx): $150 million
Change in Net Working Capital (ΔNWC): $30 million
First up, we calculate NOPAT: NOPAT = $500 million × (1 - 0.25) = $375 million
That $375 million is the company’s theoretical after-tax operating profit, assuming no debt. Now, we just make the cash flow adjustments.
Plug it all into the main formula: FCFF = $375 million (NOPAT) + $100 million (D&A) - $150 million (CapEx) - $30 million (ΔNWC) FCFF = $295 million
Boom. The company generated $295 million in free cash flow available to all of its capital providers—both debt and equity holders.
The NOPAT method is elegant because it never touches financing items like interest expense. It starts with pure operating profit, adjusts for taxes, and then makes the necessary cash adjustments. You get a clean, unlevered result every single time.
Why This Method Is a Favorite for DCF
The real reason the NOPAT approach is king in valuation comes down to its conceptual purity. A DCF model is built to find a company's Enterprise Value—the total value of its core operations available to all investors, debt and equity alike.
To get there, you have to discount its unlevered free cash flows (FCFF) using a discount rate that reflects the blended risk to all those investors. That's the WACC.
The NOPAT method creates a perfect, logical alignment:
It starts with operating profit (EBIT), ignoring the financing structure from the get-go.
It calculates an unlevered profit (NOPAT), showing after-tax earnings independent of debt.
It produces an unlevered cash flow (FCFF)—the cash available before any debt payments are made.
This clean FCFF figure can then be discounted by WACC without any weird inconsistencies. Trying to discount a levered cash flow (like FCFE) with WACC would be mixing apples and oranges. It just doesn't work. For anyone trying to build a defensible financial model, that kind of consistency is everything.
A Practical Shortcut Using Cash Flow from Operations
So far, we've built Free Cash Flow to the Firm from the ground up, starting with either EBIT or Net Income. These are the gold-standard methods for a detailed financial model.
But what if you're in a pinch? What if you need a quick, reliable number for a sanity check or a first-pass analysis?
That’s where starting with Cash Flow from Operations (CFO) comes in. It’s a powerful shortcut that pulls a number straight from the Statement of Cash Flows, saving you a ton of time.
The beauty of this approach is what CFO already accounts for. By definition, CFO starts with Net Income and then adjusts for non-cash charges like D&A and changes in net working capital. The heavy lifting is already done.
The CFO to FCFF Formula
Since CFO handles two of our biggest adjustments right out of the gate, the formula to get to FCFF is much cleaner.
FCFF = Cash Flow from Operations (CFO) + [Interest Expense × (1 − Tax Rate)] − Capital Expenditures (CapEx)
Let's quickly walk through the logic:
Start with CFO: This is the cash generated by the company's core day-to-day business. You'll find it at the top of the cash flow statement.
Add back After-Tax Interest Expense: This is the key adjustment you can't forget. CFO is calculated after interest payments, which makes it a levered (post-debt) metric. To get to an unlevered FCFF, we have to add back the interest expense, adjusted for the tax shield.
Subtract Capital Expenditures (CapEx): Just like our other methods, we subtract the cash the company is plowing back into its asset base to maintain and grow operations.
This approach is incredibly efficient. Using CFO as a starting point simplifies the calculation, making it ideal for analysts who might not have a full-blown income statement handy. It gained a lot of traction during the oil crises of the 1970s when investors started prioritizing hard cash metrics over accounting profits. By 2010, its use was widespread, with 92% of US filings reporting standardized CFO figures.
Just look at Apple's 2023 financials: a CFO of $110 billion minus $11 billion in CapEx gets you a quick-and-dirty FCFF of $99 billion. For more on the history of these calculation methods, check out these insights on FCFF calculation.
When to Use This Shortcut
This method is your go-to in a few real-world scenarios. It's perfect for back-of-the-envelope math during a meeting or when you're screening a list of potential investment ideas.
Think about these situations:
Interview Brain Teasers: If an interviewer puts you on the spot and asks you to estimate a company's FCFF, this is the fastest route to a solid answer.
Preliminary Analysis: You're taking a first look at a company and don't need a full DCF just yet. This gives you a quick read on its cash-generating power.
Data Limitations: Sometimes you only have a company’s cash flow statement. This method lets you calculate FCFF without needing the income statement for EBIT or interest details.
The CFO method is all about speed and efficiency. It’s a fantastic sanity check to make sure your more detailed, bottom-up model is in the right ballpark. If your two numbers are wildly different, it’s a red flag to go back and check your work.
One word of caution, though. While it's incredibly useful, this shortcut can be less precise if the CFO figure includes unusual one-time items. Always have a look at what's actually driving that headline CFO number before you rely on it completely.
Common Adjustments and Pitfalls to Avoid
Knowing the formulas is just the start. The real test is when you're staring at a messy, real-world 10-K at 1 AM. This is where the theory hits reality, and where a small mistake can throw off your entire valuation.
Let's get into the nuances—the common traps that trip up junior analysts and the adjustments that textbooks often gloss over. Mastering this stuff is what separates a decent model from a great one.
Critical Adjustments You Can't Ignore
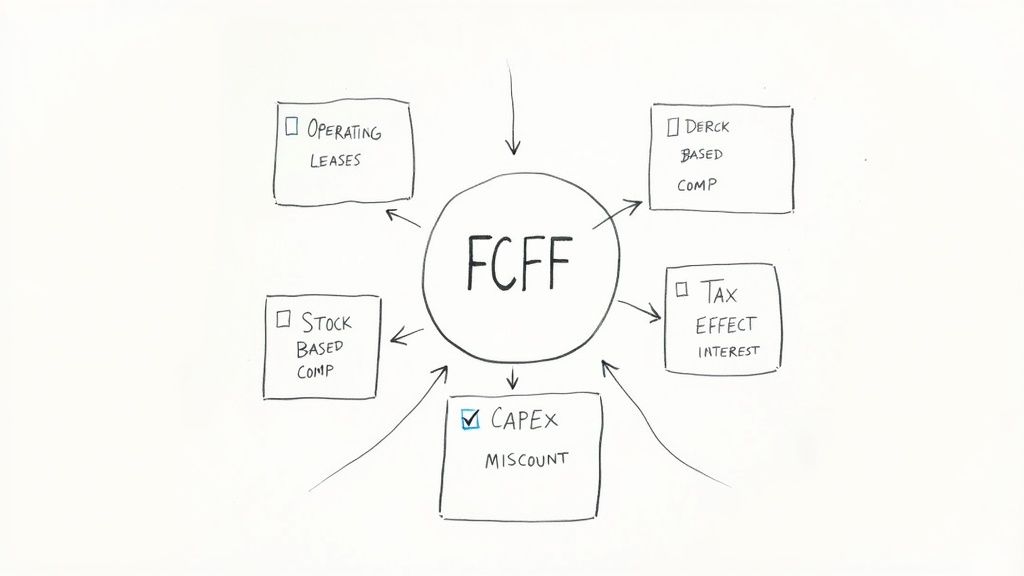
Look beyond the main formula components. A few specific line items can materially distort your FCFF if you handle them wrong. These aren't just edge cases; they show up all the time.
Stock-Based Compensation (SBC): This is a huge one, especially for tech companies. SBC is a non-cash expense that gets deducted on the income statement, lowering reported profit. But since no cash actually left the building, you have to add it back to NOPAT, just like you do with D&A. Forgetting this will seriously understate your FCFF.
Operating Leases: After the recent accounting changes (ASC 842 / IFRS 16), operating leases are now on the balance sheet. For valuation purposes, it's standard practice to treat them like debt. That means adding the lease-related interest expense back to EBIT and including the lease liability in your Enterprise Value calculation.
Deferred Taxes: This one can be tricky. Think of an increase in a company's deferred tax liability as an interest-free loan from the government. It's a source of cash. So, an increase in deferred tax liabilities needs to be added back in your FCFF build-up, similar to a non-cash charge. A decrease, naturally, is a use of cash.
A classic interview question is how a non-recurring item, like a big restructuring charge, impacts FCFF. The key is to ask yourself: was it a real cash outflow? If it was, and it was already included in EBIT, you may need to add it back to normalize your NOPAT for a go-forward valuation.
Sidestepping Common Calculation Errors
Accuracy is everything. One slip-up can ripple through your DCF and lead to a completely wrong valuation. Over the years, I've seen the same handful of mistakes catch even the sharpest analysts off guard.
One of the most frequent errors is confusing Capital Expenditures (CapEx). Some analysts just grab the depreciation number from the income statement and use it as a proxy for CapEx. While they might be close for a very stable, no-growth company, they are often wildly different for any business that's actually investing in its future. Always pull your CapEx figure from the cash flow statement.
Another classic pitfall is messing up the Net Working Capital (NWC) calculation. People often forget to exclude cash and short-term debt from the calculation. Remember, NWC should only reflect operating assets and liabilities—things like accounts receivable, inventory, and accounts payable.
To make this crystal clear, here’s a breakdown of common mistakes versus the correct, professional methodology.
Common FCFF Calculation Errors vs Best Practices
Getting these details right is what makes an analysis defensible. Here’s a quick look at where people go wrong and how to stay on track.
Common Mistake | Why It's Wrong | The Correct Approach |
|---|---|---|
Using Depreciation for CapEx | Depreciation is a non-cash, backward-looking accounting expense. CapEx is a forward-looking cash investment. | Always pull CapEx directly from the Cash Flow Statement under "Investing Activities." |
Forgetting to Tax-Affect Interest | When starting from CFO, the full interest expense has been deducted. Not accounting for the tax shield double-counts the tax impact. | Add back the after-tax interest expense: Interest Expense × (1 - Tax Rate). |
Including Cash in NWC | Changes in cash are a result of the model, not an input into operating cash needs. | Calculate NWC using only non-cash operating current assets and non-debt operating current liabilities. |
Ignoring Deferred Taxes | An increase in the Deferred Tax Liability is a source of cash that isn't captured in EBIT or NOPAT. | Add back the period-over-period increase in Deferred Tax Liabilities as a non-cash charge. |
Avoiding these mistakes isn't just about technical correctness; it's about building a model you can stand behind. When your VP or MD starts digging into your numbers, you need to be confident that every input is clean, logical, and sourced correctly.
Putting FCFF to Work in Valuation and Interviews
Knowing how to crunch the numbers for FCFF is one thing. Actually understanding what to do with it is where the real value lies. In finance, FCFF isn't just another line item on a spreadsheet—it’s the engine that drives a company’s valuation and a cornerstone of technical interview questions.
The most common place you'll see FCFF in action is a Discounted Cash Flow (DCF) model. The whole point of a DCF is to figure out what a company is worth today based on the cash it’s expected to spit out in the future.
To do this, you project a company's FCFF over a certain period—usually five to ten years—and then discount those future cash flows back to today's value using the Weighted Average Cost of Capital (WACC). What you're left with is the company's Enterprise Value, which is the total value of the business before considering how it's financed.
Nailing the Finance Interview
Beyond building models, a rock-solid grasp of FCFF is non-negotiable for any serious finance interview. Recruiters aren't just looking for someone who can follow a formula; they want to see if you can think critically about what the numbers actually mean for the business.
You need to be ready to talk about what makes a company's FCFF go up or down. To get prepped, think through these questions:
What drives this company’s profitability? At the end of the day, higher operating margins (EBIT) flow straight through to a higher FCFF, all else being equal.
How capital-intensive is this business? A manufacturing or industrial company that has to constantly sink cash into new machinery (heavy CapEx) is going to have a much lower FCFF than a software company.
How good is it at managing working capital? If a business has tons of cash tied up in inventory that isn't selling or is slow to collect cash from its customers, its FCFF is going to take a hit.
Being able to walk through these drivers shows you have commercial awareness, not just academic knowledge. For a deeper dive on this, check out our guide to common investment banking technical questions.
In an interview, confidently state: "FCFF represents the total cash flow generated by a company's core operations available to all capital providers. It’s unlevered, making it the ideal metric for a DCF valuation when discounting with WACC to arrive at Enterprise Value."
Quick Mental Checks and Key Distinctions
When you're under pressure, you need a few shortcuts. A quick way to sense-check an FCFF number is to compare it to EBITDA. FCFF will almost always be significantly lower than EBITDA. Why? Because FCFF accounts for taxes, CapEx, and changes in working capital—three massive cash drains that EBITDA completely ignores.
Finally, you absolutely have to be able to explain the difference between FCFF and Free Cash Flow to Equity (FCFE).
The key distinction is who the cash belongs to. FCFF is the cash flow available to all investors—both debt and equity holders. FCFE is what’s left over only for equity holders after all debt obligations (interest and principal payments) are taken care of.
Think of it this way: FCFF is the whole pizza, and FCFE is the slice left for shareholders after the bank gets paid.
Sticking Points: Answering Common FCFF Questions
Even when you have the formulas down cold, a few questions always pop up when you're in the weeds of a real valuation. Getting these straight is the difference between sounding like you memorized a textbook and sounding like you actually know what you're doing.
FCFF vs. FCFE: Who Gets the Cash?
This is probably the most common point of confusion. The easiest way to think about it is to ask: whose cash is it?
Free Cash Flow to the Firm (FCFF) is the total cash flow the business generates before paying its debt holders. It belongs to all capital providers—both the people who own the company (equity holders) and the people who lent it money (debt holders).
Free Cash Flow to Equity (FCFE) is what’s left over after the company has paid the interest and principal on its debt. This is the cash that belongs only to shareholders.
You’ll use FCFF for most standard DCF valuations. Why? Because you're trying to find the value of the entire business, independent of how it's financed. You then discount those FCFF figures using the Weighted Average Cost of Capital (WACC) to arrive at the company's Enterprise Value.
FCFE, on the other hand, is useful if you want to value a company's equity directly. It’s more common for stable companies with predictable debt levels, and you’d discount it using the Cost of Equity.
What if FCFF is Negative?
Seeing a negative FCFF number isn't an immediate cause for panic. Context is everything.
For a high-growth company—think a biotech startup burning through cash in clinical trials or a SaaS company hiring a massive sales team—negative FCFF is often the plan. The company is strategically investing heavily in CapEx and working capital to capture a market and generate much larger cash flows in the future.
But if you're looking at a mature, stable business, consistently negative FCFF is a major red flag. It could point to serious problems like operational inefficiency, sloppy working capital management, or out-of-control spending.
Think about Amazon in its early days. Its negative FCFF was a sign of aggressive, value-creating investment. For a struggling department store chain today, it might just signal distress.
Ready to stop memorizing formulas and start mastering concepts for your interviews? AskStanley AI provides infinite technical questions, realistic mock interviews, and adaptive drills to build the confidence you need. Prepare smarter, not just harder, at https://www.askstanley.ai.