
A Guide to Inventory on a Balance Sheet for Finance Pros

On the balance sheet, inventory is a current asset, but it's much more than just a number. It’s the lifeblood of any company that makes or sells physical products. For retail, manufacturing, or wholesale businesses, inventory is often one of the biggest and most important assets they own, representing the very core of their operations.
Why Inventory Is a Critical Balance Sheet Account
Think of a simple business, like a local bakery. Its inventory isn't just one static item. It’s a dynamic mix of goods at different stages. You've got the raw ingredients like flour and sugar, the dough that’s currently rising, and the finished loaves of bread ready for sale. Just like that bakery, every product-based company relies on its inventory to bring in money.
That’s why understanding inventory on a balance sheet is so critical for anyone analyzing a company’s financial health.
Inventory is labeled a current asset because the business expects to sell it—and turn it into cash—within one year or a single business cycle. Its value directly feeds into key financial metrics, making it a major focus for investors, analysts, and management alike. You can see how inventory fits into the bigger financial picture in our simple guide to the three financial statements.
The Three Core Types of Inventory
To really get what’s going on, you have to break inventory down into its three main parts. Each one represents a different step in the journey from raw input to final sale.
Here’s a simple table to lay it all out:
Inventory Type | Description | Example |
|---|---|---|
Raw Materials | The basic inputs a company buys to create its products. These are the ingredients waiting to be used. | For a car manufacturer, this is steel, plastic, and glass. For our bakery, it’s flour and eggs. |
Work-in-Progress (WIP) | Goods that are partially built but not yet ready to be sold. They're stuck in the middle of the production line. | An unfinished car chassis on the assembly line or the bakery's dough that's proofing. |
Finished Goods | The final products, fully assembled and sitting on the shelf, ready for a customer to buy. | A brand-new car in the showroom or a fresh loaf of bread on the bakery's display rack. |
On the balance sheet, the total value of these three categories gets rolled up into a single line item: Inventory. This one number represents a huge amount of a company’s capital, all tied up in goods until they finally get sold.
And the scale of this investment across the economy is massive. In the United States alone, total business inventories hit a staggering $2.67 trillion as of September 2025. That’s an enormous amount of cash locked up in warehouses and on store shelves. This figure alone shows why managing inventory efficiently isn't just a small operational detail—it's a key driver of profitability for countless businesses.
How Companies Value Their Inventory
Putting inventory on the balance sheet is more than just counting boxes in a warehouse. You have to assign a specific dollar value to those goods, and that number directly hits a company's reported assets, profit, and even its tax bill. This isn't just guesswork; it's a strategic choice guided by specific accounting methods that make assumptions about how costs flow through a business.
Think about a grocery store buying milk. They buy 100 cartons on Monday for $2.00 each. Then, on Wednesday, the price goes up, and they buy another 100 cartons for $2.20 each. When a customer buys a carton on Friday, which cost does the store use to calculate its profit? The $2.00 from the first batch or the $2.20 from the second? This is the exact problem inventory valuation methods solve.
The choice a company makes here can significantly alter the financial picture it presents to investors and analysts, making this a critical concept for any aspiring finance professional to nail down.
The visual below illustrates the simple flow of goods, from their initial state to the final product ready for sale.
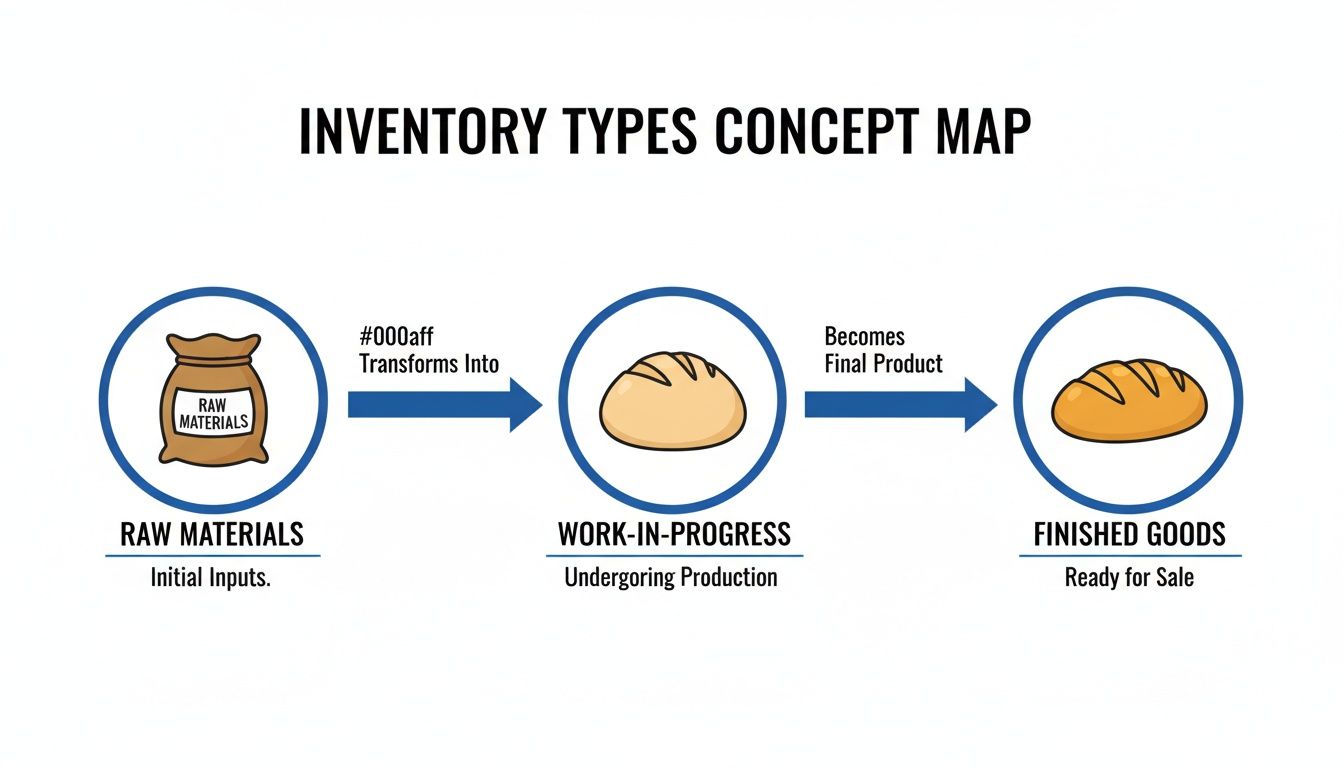
This map shows how a bakery's raw materials like flour get transformed into work-in-progress (dough) before finally becoming finished goods—a loaf of bread ready to be sold.
Cost Flow Assumptions: FIFO, LIFO, and Weighted-Average
Accountants use three main methods, known as cost flow assumptions, to figure out the value of both the inventory left on the shelves (on the balance sheet) and the inventory that was sold (Cost of Goods Sold, or COGS). These aren't necessarily about the physical movement of goods, but are accounting conventions.
First-In, First-Out (FIFO): This method assumes the first items you bought are the first ones you sell. It’s intuitive—like a grocery store pushing older milk cartons to the front of the shelf. During periods of rising prices (inflation), FIFO gives you a higher ending inventory value on the balance sheet and a lower COGS on the income statement, which means higher reported profits.
Last-In, First-Out (LIFO): LIFO assumes the most recently purchased items are the first ones sold. Picture a pile of sand at a construction site—workers always take sand from the top of the pile (the newest additions) first. In an inflationary environment, LIFO results in a lower ending inventory value, a higher COGS, and therefore, lower reported net income. The big upside? A lower tax bill because of the lower profit.
Weighted-Average Cost: This method smooths everything out by calculating one average cost for all goods. You just divide the total cost of all your inventory by the total number of units. That average cost is then used for both the items you sold and the ones still sitting in inventory.
Key Takeaway: The choice between FIFO and LIFO really matters when prices are changing. FIFO gives a more current picture of inventory value on the balance sheet, while LIFO often does a better job of matching current costs with current revenues on the income statement.
Comparing the Methods With an Example
Let's see these methods in action. Say a company, TechGadgets Inc., makes the following purchases of a microchip during a quarter:
Purchase 1 (Jan 10): 100 units @ $10/unit
Purchase 2 (Feb 15): 150 units @ $12/unit
Purchase 3 (Mar 20): 120 units @ $15/unit
In total, TechGadgets has 370 units available for sale at a total cost of $4,600. Now, let's assume they sell 200 units during the quarter. Here’s how the inventory on the balance sheet would look under each method.
Valuation Method | Calculation for COGS (200 Units Sold) | Ending Inventory Value (170 Units Left) |
|---|---|---|
FIFO | (100 units x $10) + (100 units x $12) = $2,200 | (50 units x $12) + (120 units x $15) = $2,400 |
LIFO | (120 units x $15) + (80 units x $12) = $2,760 | (20 units x $12) + (100 units x $10) = $1,240 |
Weighted-Average | Avg Cost: $4,600 / 370 = $12.43. COGS = 200 x $12.43 = $2,486 | 170 units x $12.43 = $2,113.10 |
As you can see, the value of the ending inventory on a balance sheet can swing by over $1,000 just based on the accounting method chosen. This difference flows right through to assets, equity, and key financial ratios.
The Prudence Principle: Lower of Cost or Net Realizable Value
No matter which cost flow method is used, there's another rule in play: the principle of conservatism. This leads to the Lower of Cost or Net Realizable Value (LCNRV) rule, which exists to stop companies from overstating the value of their assets.
Net Realizable Value (NRV) is simply the estimated selling price of an item minus any costs needed to complete and sell it. Think of it as the realistic cash value the company actually expects to get from that piece of inventory.
If the NRV of an inventory item drops below its original cost—maybe it's damaged, obsolete, or market prices have crashed—the company must write down the inventory's value to its NRV. This write-down hits the income statement as an expense, lowering profit but making sure the balance sheet shows a more accurate, conservative asset value. For example, if an old smartphone model becomes nearly worthless after a new one is released, its NRV plummets, forcing the manufacturer to record a write-down.
Tracking Inventory with Journal Entries
Okay, theory is one thing, but seeing how inventory moves through a company’s books is where it really clicks. Every time a business buys, sells, or adjusts its stock, a journal entry gets made. Think of these entries as the language of accounting—they translate real-world business actions into the numbers you see on the financial statements.
Let's walk through the basic journal entries that follow inventory from the warehouse shelf to a customer's hands. This is how you see the direct link between inventory on the balance sheet (an asset) and the Cost of Goods Sold (COGS) on the income statement (an expense).
Recording an Inventory Purchase
First things first: buying the goods. Let’s imagine a company called "GadgetPro" buys 100 smartwatches from its supplier for $50 a pop. That's a $5,000 total purchase. They buy on credit, which just means they’ll pay the supplier later.
Here's the journal entry to put this on the books:
Debit: Inventory ($5,000)
This increases the Inventory account, which is an asset on the balance sheet. GadgetPro now has more stuff it can sell.
Credit: Accounts Payable ($5,000)
This increases the Accounts Payable account, a liability. GadgetPro now owes more money.
At this stage, the balance sheet grew by $5,000 in assets (Inventory) and $5,000 in liabilities (Accounts Payable). The company's equity is untouched.
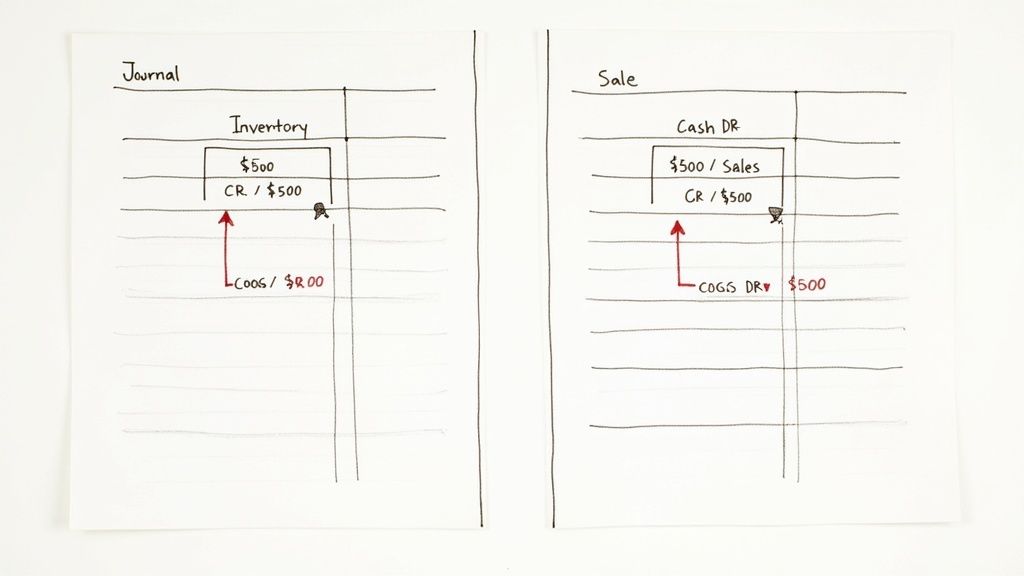
The Two-Part Entry for a Sale
This is where the magic happens. A single sale triggers two entries that connect the balance sheet directly to the income statement. It’s a critical concept to grasp.
Let's say GadgetPro sells one smartwatch to a customer for $120 in cash.
Part 1: The Revenue Entry
First, we log the money coming in.
Debit: Cash ($120)
This boosts the Cash asset account.
Credit: Sales Revenue ($120)
This increases Sales Revenue on the income statement, driving the company's top line.
Part 2: The COGS Entry
Now, we have to account for the fact that an asset—the smartwatch—just walked out the door. Its cost officially becomes an expense.
Debit: Cost of Goods Sold ($50)
This increases the COGS expense on the income statement, which will reduce profits.
Credit: Inventory ($50)
This reduces the Inventory asset on the balance sheet, because one unit is gone.
The Key Connection: This two-step process is crucial. The first entry books the revenue, and the second perfectly matches the cost of that sale to the revenue it generated. This is the matching principle in action, and it's how you get an accurate picture of profitability.
Handling Inventory Write-Downs
What if inventory loses value? As we covered with the LCNRV rule, companies have to write down inventory that gets damaged or becomes obsolete.
Suppose GadgetPro finds that five of its smartwatches were damaged and are now worthless. Their original cost was $250 (5 watches x $50).
The journal entry for this write-down is simple:
Debit: Inventory Write-Down Expense ($250)
An expense is created, which hits the income statement and lowers net income. Sometimes this gets bundled directly into COGS.
Credit: Inventory ($250)
The Inventory asset account on the balance sheet is reduced to reflect its true, diminished value.
This entry ensures the inventory on the balance sheet isn't overstated and that the loss is recognized in the period it actually happened. Nailing these journal entries is non-negotiable for anyone in finance—it’s the mechanical foundation for understanding how a company’s operations actually impact its financial health.
Using Financial Ratios to Analyze Inventory
The journal entries and raw numbers for inventory are just the starting point. The real magic happens when you use that data for financial analysis. For anyone prepping for finance interviews, understanding how inventory on a balance sheet impacts the key metrics is a must-know. Ratios are what turn that raw data into actual insight, revealing how efficient and stable a company really is.
By digging into these metrics, you can see past the surface-level numbers. Is the company tying up too much cash in products that aren't selling? Is its accounting method making things look better than they are? Let's get into the ratios that bring these questions to light.
Gauging Liquidity with Inventory in Mind
Liquidity ratios are all about a company's ability to pay its short-term bills. Inventory is a huge piece of this puzzle, but analysts are always a bit skeptical of it. Why? Because you can't pay your bills with a warehouse full of sweaters—you have to sell them first.
Two key liquidity ratios are heavily influenced by inventory:
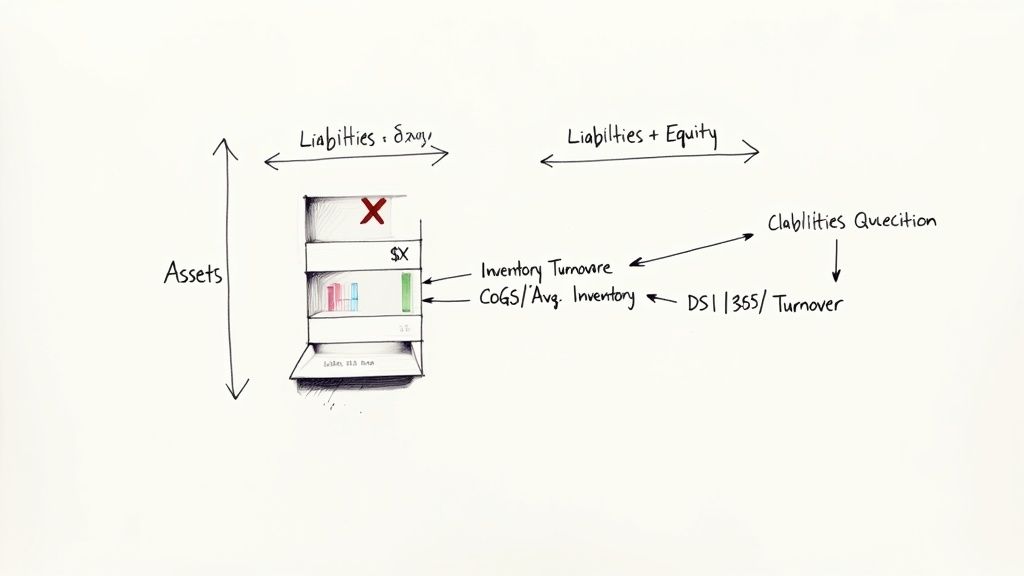
Current Ratio: Calculated as Current Assets / Current Liabilities, this gives a broad look at a company's ability to cover its immediate debts. But a high inventory balance can inflate current assets, making a company look safer than it is. If that inventory is obsolete or just not moving, the ratio is basically lying to you.
Quick Ratio (or Acid-Test Ratio): Calculated as (Current Assets - Inventory) / Current Liabilities, this ratio is much more conservative. By pulling inventory out of the equation, the quick ratio asks a tougher question: can the company pay its bills without having to sell off its stock? A big gap between the current and quick ratios is a red flag that the company is leaning too heavily on its inventory.
Think about a retailer with a current ratio of 2.5. Looks great, right? But if its quick ratio is only 0.8, it tells you that most of its current assets are just stuff sitting on shelves. That's a huge cash flow risk if sales suddenly dry up.
Measuring Efficiency with Turnover and DSI
Beyond just paying the bills, inventory ratios tell you how efficiently a company is running its core business. These are the kinds of metrics you'll absolutely need to master for many investment banking case studies, where you're tasked with figuring out how well a target company is actually performing.
Inventory Turnover Ratio
This ratio tells you how many times a company sells and restocks its entire inventory over a period. It's a direct measure of how fast products are flying off the shelves.
Formula: Inventory Turnover = Cost of Goods Sold (COGS) / Average Inventory
A high turnover is almost always a good sign—it means sales are strong and management knows what it's doing. A low turnover, on the other hand, might point to overstocking, stale products, or just plain weak demand. Context is also key; a "good" turnover for a car dealership is going to be completely different from a fast-fashion brand like Zara.
Days Sales of Inventory (DSI)
Also called Days Inventory Outstanding (DIO), this metric translates the turnover ratio into the average number of days it takes to sell through inventory.
Formula: DSI = 365 / Inventory Turnover Ratio
A lower DSI is better because it means cash isn't locked up in inventory for too long. For example, a DSI of 45 days means it takes the company, on average, a month and a half to clear its stock. If you see a company's DSI creeping up over several quarters, it could be a warning sign that its products are getting old.
How Valuation Methods Impact Ratios
The choice between FIFO and LIFO isn't just an accounting detail; it completely changes the story the ratios tell, especially when prices are changing.
Let's imagine two identical companies. Company A uses FIFO, and Company B uses LIFO, both operating in a period of rising costs (inflation).
Metric | Company A (FIFO) | Company B (LIFO) | Analytical Insight |
|---|---|---|---|
Ending Inventory | Higher | Lower | FIFO's inventory is valued at newer, higher costs, inflating the balance sheet. |
COGS | Lower | Higher | LIFO expenses the most recent (and more expensive) inventory first. |
Net Income | Higher | Lower | Because FIFO has lower COGS, its reported profit is higher. |
Inventory Turnover | Lower | Higher | LIFO's higher COGS and lower inventory balance make its turnover ratio look better. |
An analyst just glancing at the inventory turnover ratio might think Company B is more efficient. But a real analyst knows this is just an accounting artifact. While Company A looks more profitable on paper, Company B's higher COGS means it pays less in taxes, which frees up more cash.
This is a classic trade-off: FIFO looks better for reported earnings, while LIFO is often better for tax efficiency when costs are rising. Understanding this is critical to making a fair, apples-to-apples comparison between companies.
Finding Hidden Details in Inventory Disclosures
The number you see for inventory on a balance sheet is just the headline. To really understand a company's health, you have to play detective and dig into the footnotes of its annual report. That’s where the real story—the context behind the single number—is hidden.
These disclosures, usually tucked away in the "Notes to Consolidated Financial Statements," are required by accounting standards like GAAP and IFRS. They spill the details on how aggressively or conservatively a company is managing one of its most critical assets. For an analyst, skipping the footnotes is like trying to understand a movie by only watching the trailer.
Decoding the Footnotes: What to Look For
When you find the inventory section of the footnotes, you're hunting for specific clues that paint a much clearer picture of what's going on. These details are everything when you're comparing competitors or trying to spot red flags before they blow up the bottom line.
Here’s exactly what you should be looking for:
Valuation Method: The company has to tell you if it uses FIFO, LIFO, or a weighted-average method. This is priority number one. It directly impacts both the inventory value on the balance sheet and the COGS on the income statement, especially when prices are changing.
Inventory Breakdown: Most companies break their inventory into three core buckets: raw materials, work-in-progress, and finished goods. This tells you where the company's cash is tied up. A big jump in raw materials might mean they're ramping up production, but a surge in finished goods could signal that sales are slowing down.
Inventory Write-Downs: This is a big one. Companies have to disclose any major write-downs from obsolete or damaged goods. If you see a large or recurring write-down, it’s a major red flag. It points to serious problems with product demand, quality control, or inventory management.
A Real-World Example
Let’s look at a hypothetical disclosure from a retailer, "Global Mart Inc.," to see how this works.
Note 4: Inventories Inventories are stated at the lower of cost or net realizable value. Cost is determined using the First-In, First-Out (FIFO) method. As of December 31, 2024, our inventory consisted of the following (in millions):
Finished Goods: $45,200
Work-in-Progress: $2,100
Raw Materials: $4,500
Total Inventory: $51,800
During the fiscal year 2024, we recorded an inventory write-down of $750 million related to discontinued electronics product lines, which is included in Cost of Goods Sold.
This short note tells us a ton. Global Mart uses FIFO, so if prices are rising, its reported profit is probably higher than a competitor using LIFO. The bulk of its inventory is finished goods, which makes sense for a retailer.
But here’s the kicker: that $750 million write-down. It signals a massive problem in their electronics division—a critical detail you would’ve completely missed just by looking at the balance sheet. This single piece of information transforms your analysis from a simple number-check into a real strategic assessment.
Answering Tough Interview Questions About Inventory
Technical interviews aren't just about memorizing formulas. They’re designed to see if you can actually think like an analyst. Questions about how inventory on a balance sheet flows through the three financial statements are a classic way interviewers test your fundamental accounting grasp.
Nailing these questions shows you can connect the dots between a company's day-to-day operations and its financial reports. So let’s walk through the most common questions you'll get and how to answer them in a way that truly impresses.
The Classic Three-Statement Question
The one you're almost guaranteed to hear is some version of: "Walk me through how a $10 increase in inventory impacts the three financial statements." This isn't a trick question; it's a test of the basics.
Here’s the clearest way to structure your answer:
Start with the Income Statement: An initial purchase of inventory has zero impact here. Buying inventory isn't an expense—it's just converting one asset (cash) into another (inventory). The expense, COGS, only hits the income statement when that inventory is actually sold.
Move to the Cash Flow Statement: This is where the action is. Buying inventory costs money. On the Statement of Cash Flows, cash from operations will decrease by $10. You spent cash to acquire an asset, so it's a cash outflow.
End with the Balance Sheet: The balance sheet has to balance, always. On the asset side, Cash is down by $10, but the Inventory account is up by $10. The two changes net out perfectly. Total assets are unchanged, and the accounting equation (Assets = Liabilities + Equity) remains in balance.
Model Answer Snippet: "Initially, there's no change on the income statement because the inventory hasn't been sold yet. On the cash flow statement, cash from operations decreases by $10 to reflect the purchase. Finally, on the balance sheet, cash is down $10 and inventory is up $10, so total assets remain the same and the statement balances."
The LIFO vs FIFO Strategy Question
Another common question gets more into the why: "Why would a company choose LIFO in a rising price environment?" The interviewer wants to see if you understand the real-world business implications, not just the textbook definition.
Even though most of the world uses FIFO (IFRS doesn't even allow LIFO), this is still fair game in US-based interviews. It's all about the cash.
Higher COGS: In an inflationary world, prices are going up. LIFO expenses the most recently purchased—and therefore most expensive—inventory first. This results in a higher Cost of Goods Sold.
Lower Taxable Income: A higher COGS flows down the income statement, leading directly to lower reported pre-tax income.
Tax Savings: This is the punchline. Lower reported profits mean a lower tax bill. By paying less in taxes, the company generates higher operating cash flow.
The Bottom Line: The main reason a company uses LIFO when prices are rising is to defer taxes. They're willing to report lower net income on paper in exchange for the very real benefit of keeping more cash in the bank today.
Getting comfortable with these questions is a huge part of being ready for your interviews. For more practice, check out our deep dive into the most common investment banking technical questions.
Common Questions About Inventory on the Balance Sheet
Let's wrap this up by hitting a few common questions that always seem to pop up in interviews or when you're digging through a 10-K. Getting these down solidifies the concepts we've already covered.
Can a Company Just Switch Valuation Methods Whenever It Wants?
Not really. Switching your inventory method, say from FIFO to LIFO, isn't something a company can do on a whim just to make the numbers look better for a quarter.
Under U.S. GAAP, you can only make the change if you can prove the new method is "preferable" – meaning it gives a more accurate picture of the company's financial reality. This is a big deal. It’s a change in accounting principle, so you have to go back and restate your prior financial statements as if you'd been using the new method all along. You also have to explain exactly why you did it in the footnotes.
What's the Real Difference Between Perpetual and Periodic Systems?
It all comes down to timing and technology. How often do you count your stuff?
A perpetual inventory system is what most modern businesses use. Every time an item is bought or sold, the inventory records update in real-time. It gives you a constant, up-to-the-minute look at what you have on hand and what your COGS is.
A periodic inventory system, on the other hand, is old-school. You only figure out your inventory and COGS at the end of a period (like a month or quarter) by doing a full physical count. It's simpler, but you're flying blind most of the time, making it tough to spot issues like theft or damage until it's too late.
How Does Inventory Financing Show Up on the Balance Sheet?
When a company uses its inventory as collateral to get a loan, it's called inventory financing. This move hits the balance sheet in a couple of places.
First, the company gets cash, so the Cash asset account goes up. At the same time, it takes on a new liability, so an account like Notes Payable or Debt also increases. Simple enough.
The Inventory account itself doesn't usually change, but there's a critical catch. The company must disclose in the footnotes to the financial statements that a certain amount of its inventory is pledged as collateral. For any investor or lender, that's crucial info for understanding the company's true risk profile.
Ready to master the technical questions that win offers? AskStanley AI provides unlimited, realistic mock interviews and adaptive drills to ensure you're prepared for any question about inventory, valuation, or accounting. Start your journey to interview excellence at https://www.askstanley.ai.